- Our public web presence (www.netflix.com and movies.netflix.com)
- Edge services for movie data and playback support
- Content delivery services - static assets and audio/video streams
Enabling Support for IPv6
Benchmarking High Performance I/O with SSD for Cassandra on AWS
Benchmarking
Last year we published an Apache Cassandra performance benchmark that achieved over a million client writes per second using hundreds of fairly small EC2 instances. We were testing the scalability of the Priam tooling that we used to create and manage Cassandra, and proved that large scale Cassandra clusters scale up linearly, so ten times the number of instances gets you ten times the throughput. Today we are publishing some benchmark results that include a comparison of Cassandra running on an existing instance type to the new SSD based instance type.
Summary of AWS Instance I/O Options
There are several existing storage options based on internal disks, these are ephemeral - they go away when the instance terminates. The three options that we have previously tested for Cassandra are found in the m1.xlarge, m2.4xlarge, and cc2.8xlarge instances, and this is now joined by the new SSD based hi1.4xlarge. AWS specifies relative total CPU performance for each instance type using EC2 Compute Units (ECU).
Instance Type | CPU | Memory | Internal Storage | Network |
m1.xlarge | 4 CPU threads 8 ECU | 15GB RAM | 4 x 420GB Disk | 1 Gbit |
m2.4xlarge | 8 CPU threads 26 ECU | 68GB RAM | 2 x 840GB Disk | 1 Gbit |
hi1.4xlarge (Westmere) | 16 CPU threads 35 ECU | 60GB RAM | 2 x 1000GB Solid State Disk | 10 Gbit |
cc2.8xlarge (Sandybridge) | 32 CPU threads 88 ECU | 60GB RAM | 4 x 840GB Disk | 10 Gbit |
The hi1.4xlarge SSD Based Instance
This new instance type provides high performance internal ephemeral SSD based storage. The CPU reported by /proc/cpuinfo is an Intel Westmere E5620 at 2.4GHz with 8 cores and hyper threading, so it appears as 16 CPU threads. This falls between the m2.4xlarge and cc2.8xlarge in CPU performance, with similar RAM capacity, and a 10Gbit network interface like the cc2.8xlarge.
The disk configuration appears as two large SSD volumes of around a terabyte each, and the instance is capable of around 100,000 very low latency IOPS and a gigabyte per second of throughput. This provides hundreds of times higher throughput than can be achieved with other storage options, and has extremely low latency and variance, since the hi1.4xlarge instance has local access to the SSD, and there is no network traffic in the storage path.
Benchmark Results
The first thing to do with a new storage subsystem is basic filesystem level performance testing, we used the iozone benchmark to verify that we could get over 100,000 IOPS and 1 GByte/s of throughput at the disk level, at a very low service time per request, 20 to 60 microseconds.
iozone with 60 threads | I/O per second | KBytes per second | Service Time |
Sequential Writes | 16,500 64KB writes | 1,050,000 | 0.06 ms |
Random Reads | 100,000 4KB reads | 400,000 | 0.02 ms |
Mapped Random Reads | 56,000 19KB reads | 1,018,000 | 0.04 ms |
The second benchmark was to use the standard Cassandra stress test to run simple data access patterns against a small dataset, similar to the benchmark we published last year. We found that our tests were mostly CPU bound, but we could get close to a gigabyte per second of throughput at the disk for a short while during startup, as the data loaded into memory. The increased CPU performance of 35 ECUs for the hi1.4xlarge over the m2.4xlarge at 26 ECUs gave a useful speedup, but the test wasn't generating enough IOPS.
The third was more complex, we took our biggest Cassandra data store and restored two copies of it from backups, one on m2.4xlarge, and one on hi1.4xlarge, so that we could evaluate a real-world workload and figure out how best to configure the SSD instances as a replacement for the existing configuration. We concentrate on the application level benchmark next as it's the most interesting comparison.
Netflix Application Benchmark
Our architecture is very fine grain, with each development team owning a set of services and data stores. As a result, we have tens of distinct Cassandra clusters in production, each serving up a different data source. The one we picked is storing 8.5TB of data and has a rest based data provider application that currently uses a memcached tier to cache results for the read workload as well as Cassandra for persistent writes. Our goal was to see if we could use a smaller number of SSD based Cassandra instances, and do without the memcached tier, without impacting response times. Our memcached tier is wrapped up in a service we call EVcache that we described in a previous techblog post. The two configurations compared were:
- Existing system: 48 Cassandra on m2.4xlarge. 36 EVcache on m2.xlarge.
- SSD based system: 12 Cassandra on hi1.4xlarge.
This application is one of the most complex and demanding workloads we run. It requires tens of thousands of reads and thousands of writes per second. The queries and column family layout are far more complex than the simple stress benchmark. The EVcache tier absorbs most of the reads in the existing system, and the Cassandra instances aren’t using all the available CPU. We use a lot of memory to reduce the IO workload to a sustainable level.
Cost Comparison
We have already found that running Cassandra on EC2 using ephemeral disks and triple replicated instances is a very scalable, reliable and cost effective storage mechanism, despite having to over-configure RAM and CPU capacity to compensate for a relative lack of IOPS in each m2.4xlarge instance. With the hi1.4xlarge SSD instance, the bottleneck moves from IOPS to CPU and we will be able to reduce the instance count substantially.
The relative cost of the two configurations shows that over-all there are cost savings using the SSD instances. There are no per-instance software licensing costs for using Apache Cassandra, but users of commercial data stores could also see a licensing cost saving by reducing instance count.
Benefits of moving Cassandra Workloads to SSD
- The hi1.4xlarge configuration is about half the system cost for the same throughput.
- The mean read request latency was reduced from 10ms to 2.2ms.
- The 99th percentile request latency was reduced from 65ms to 10ms.
Summary
We were able to validate the claimed raw performance numbers for the hi1.4xlarge and in a real world benchmark it gives us a simpler and lower cost solution for running our Cassandra workloads.
TL;DR
What follows is a more detailed explanation of the benchmark configuration and results. TL;DR is short for "too long; don't read". If you get all the way to the end and understand it, you get a prize...
SSD hi1.4xlarge Filesystem Tests with iozone
The Cassandra disk access workload consists of large sequential writes from the SSTable flushes, and small random reads as all the stored versions of keys are checked for a get operation. As more files are written, the number of reads increases, then a compaction replaces a few smaller files with one large one. The iozone benchmark was used to create a similar workload on one hi4.4xlarge instance. The standard data size recommendation for iozone is twice the memory capacity, in this case 120GB is needed.
Using sixty threads to write 2GB files at once using 64KB writes, results in 1099MBytes/s at 0.06ms service time.
avg-cpu: %user %nice %system %iowait %steal %idle
0.19 0.00 41.90 49.77 5.64 2.50
Device: rrqm/s wrqm/s r/s w/s rMB/s wMB/s avgrq-sz avgqu-sz await svctm %util
sda1 19.60 52.90 28.00 104.40 0.66 0.61 19.64 0.54 4.11 1.87 24.80
sdb 0.00 52068.10 0.20 15645.50 0.00 549.45 71.92 85.93 5.50 0.06 98.98
sdc 0.00 52708.00 0.40 15027.10 0.00 549.65 74.91 139.66 9.30 0.07 99.31
md0 0.00 0.00 0.60 135509.40 0.00 1099.17 16.61 0.00 0.00 0.00 0.00
avg-cpu: %user %nice %system %iowait %steal %idle
0.98 0.00 19.33 54.64 8.89 16.16
Device: rrqm/s wrqm/s r/s w/s rMB/s wMB/s avgrq-sz avgqu-sz await svctm %util
sda1 0.00 0.40 0.00 0.20 0.00 0.00 24.00 0.00 2.50 2.50 0.05
sdb 0.00 0.00 50558.70 0.00 197.53 0.00 8.00 25.84 0.52 0.02 99.96
sdc 0.00 0.00 50483.80 0.00 197.23 0.00 8.00 21.15 0.43 0.02 99.95
md0 0.00 0.00 101041.70 0.00 394.76 0.00 8.00 0.00 0.00 0.00 0.00
avg-cpu: %user %nice %system %iowait %steal %idle
0.38 0.00 4.78 27.00 0.75 67.09
Device: rrqm/s wrqm/s r/s w/s rMB/s wMB/s avgrq-sz avgqu-sz await svctm %util
sda1 0.00 2.00 0.00 2.00 0.00 0.02 16.00 0.00 2.25 1.00 0.20
sdb 1680.40 0.00 28292.00 0.20 509.26 0.00 36.86 49.88 1.76 0.04 100.01
sdc 1872.20 0.00 28041.10 0.20 508.86 0.00 37.16 84.62 3.02 0.04 99.99
md0 0.00 0.00 59885.50 0.40 1018.09 0.00 34.82 0.00 0.00 0.00 0.00
Versions and Automation
Cassandra itself has moved on significantly from the 0.8.3 build that we used last year, to the 1.0.9 build that we are currently running. We have also built and published automation around the Jmeter workload generation tool, which makes it even easier to run sophisticated performance regression tests.
We currently run Centos 5 Linux and use mdadm to stripe together our disk volumes with default options and the XFS filesystem. No tuning was performed on the Linux or disk configuration for these tests.
For extensive explanation of how Cassandra works please see the previous Netflix Tech Blog Cassandra Benchmark post, and more recent post on the Priam and Jmeter code used to manage the instances and run the benchmark. All this code is Apache 2.0 licensed and hosted at netflix.github.com.
We used Java7 and the following Cassandra configuration tuning in this benchmark:
conf/cassandra-env.sh
MAX_HEAP_SIZE="10G"
HEAP_NEWSIZE="2G"
JVM_OPTS="$JVM_OPTS -XX:+UseCondCardMark"
conf/cassandra.yaml
concurrent_reads: 128
concurrent_writes: 128
rpc_server_type: hsha
rpc_min_threads: 32
rpc_max_threads: 1024
rpc_timeout_in_ms: 5000
dynamic_snitch_update_interval_in_ms: 100
dynamic_snitch_reset_interval_in_ms: 60000
dynamic_snitch_badness_threshold: 0.2
The configurations were both loaded with the same 8.5TB dataset, so the 48 m2.4xlarge systems had 177 GB per node, and the 12 hi1.4xlarge based systems had 708 GB per node. As usual, we triple-replicate all our data across three AWS Availability Zones, so this is 2.8TB of unique data per zone. We used our test environment and a series of application level stress tests.
Per-hour pricing is appropriate for running benchmarks, but for production use a long lived data store will have instances in use all the time, so the 3-year heavy use reservation provides the best price comparison against the total cost of ownership of on-premise alternatives. Both options are shown below based on US-East pricing (EU-West prices are a little higher).
Instance Type | On-Demand Hourly Cost | 3 Year Heavy Use Reservation | 3 Year Heavy Use Hourly Cost | Total 3 Year Heavy Use Cost |
m2.xlarge | $0.45/hour | $1550 | $0.070/hour | $3360 |
m2.4xlarge | $1.80/hour | $6200 | $0.280/hour | $13558 |
hi1.4xlarge | $3.10/hour | $10960 | $0.482/hour | $23627 |
System Configuration | On-Demand Hourly Cost | Total 3 Year Heavy Use Cost |
36 x m2.xlarge + 48 x m2.4xlarge | 36 x $0.45 + 48 x $1.80 = $102/hour | $772806 |
15 x hi1.4xlarge | 15 x $3.10 = $46.5/hour | $354405 |
- 80 CPU threads, 175 ECU
- 300 GB RAM
- 10 TB of durable storage.
- 500,000 low latency IOPS
- 5 Gigabytes/s of disk throughput
- 50 Gbits of network capacity
The Prize
If you read this far and made sense of the iostat metrics and Cassandra tuning options, the prize is that we'd like to talk to you, we're hiring in Los Gatos CA for our Cassandra development and operations teams and our performance team. Contact me @adrianco or see http://jobs.netflix.com
Chaos Monkey Released Into The Wild
What is Chaos Monkey?
Why Run Chaos Monkey?
Auto Scaling Groups
Configuration
REST
Costs
More Monkey Business
Netflix Shares Cloud Load Balancing And Failover Tool: Eureka!
We are proud to announce Eureka, a service registry that is a critical component of the Netflix infrastructure in the AWS cloud, and underpins our mid-tier load balancing, deployment automation, data storage, caching and various other services.
What is Eureka?
Eureka is a REST based service that is primarily used in the AWS cloud for locating services for the purpose of load balancing and failover of middle-tier servers. We call this service, the Eureka Server. Eureka also comes with a java-based client component, the Eureka Client, which makes interactions with the service much easier. The client also has a built-in load balancer that does basic round-robin load balancing. At Netflix, a much more sophisticated load balancer wraps Eureka to provide weighted load balancing based on several factors like traffic, resource usage, error conditions etc to provide superior resiliency. We have previously referred to Eureka as the Netflix discovery service.
What is the need for Eureka?
How different is Eureka from AWS ELB?
One of the solutions that the proxy based load balancers including AWS ELB offer that Eureka does not offer out of the box is sticky session based load balancing. In fact, at Netflix, the majority of mid-tier services are stateless and prefer non-sticky based load balancing as it works very well with the AWS autoscaling model.
AWS ELB is a traditional proxy-based load balancing solution whereas with Eureka load balancing happens at the instance/server/host level. The client instances know all the information about which servers they need to talk to and can contact them directly.
Another important aspect that differentiates proxy-based load balancing from load balancing using Eureka is that your application can be resilient to the outages of the load balancers, since the information regarding the available servers is cached on the client. This does require a small amount of memory, but buys better resiliency. There is also a small decrease in latency since contacting the server directly avoids two network hops through a proxy.
How different is Eureka from Route 53?
While you can register your mid-tier servers with Route 53 and rely on AWS security groups to protect your servers from public access, your mid-tier server identity is still exposed to the external world. It also comes with the drawback of the traditional DNS based load balancing solutions where the traffic can still be routed to servers which may not be healthy or may not even exist (in the case of AWS cloud where servers can disappear anytime).
How is Eureka used at Netflix?
- For aiding Netflix Asgard - an open source tool for managing cloud deployments.
- Fast rollback of versions in case of problems avoiding the re-launch of 100's of instances.
- In rolling pushes, for avoiding propagation of a new version to all instances.
- For our Cassandra deployments to take instances out of traffic for maintenance.
- For our Memcached based Evcache services to identify the list of nodes in the ring.
- For carrying other additional application specific metadata about services.
You typically run in the AWS cloud and you have a host of middle tier services which you do not want to register with AWS ELB or expose traffic from outside world. You are either looking for a simple round-robin load balancing solution or are willing to write your own wrapper around Eureka based on your load balancing need. You do not have the need for sticky sessions and load session data from an external cache such as memcached. More importantly, if your architecture fits the model where a client based load balancer is favored, Eureka is well positioned to fit that usage.
How does the application client and application server communicate?
The communication technology could be anything you like. Eureka helps you find the information of the services you would want to communicate with but does not impose any restrictions on the protocol or method of communication. For instance, you can use Eureka to obtain the target server address and use protocols such as thrift, http(s) or any other RPC mechanisms.High level architecture

Non-java services and clients
For services that are non-java based, you have a choice of implementing the client part of Eureka in the language of the service or you can run a "sidekick" which is essentially a Java application with an embedded Eureka client that handles the registrations and heartbeats. REST based endpoints are also exposed for all operations that are supported by the Eureka client. Non-java clients can use the REST endpoints to query for information about other services.Configurability
With Eureka you can add or remove cluster nodes on the fly. You can tune the internal configurations from timeouts to thread pools. Eureka uses Archaius and configurations can be tuned dynamically.Resilience
Eureka benefits from the experience gained over several years operating on AWS, with resiliency built into both the client and the servers.Eureka clients are built to handle the failure of one or more Eureka servers. Since Eureka clients have the registry cache information in them, they can operate reasonably well, even when all of the Eureka servers go down.Eureka Servers are resilient to other Eureka peers going down. Even during a network partition between the clients and servers, the servers have built-in resiliency to prevent a large scale outage.
Multiple Regions
Deploying Eureka in multiple AWS regions is a trivial task. Eureka clusters between regions do not communicate with one another.Monitoring
Eureka uses Servo to track a lot information in both the client and the server for performance, monitoring and alerting.The data is typically available in the JMX registry and can be exported to Amazon Cloud Watch.Stay tuned for
Asgard and Eureka integration.More sophisticated Netflix mid-tier load balancing solutions.
If building critical infrastructure components like this, for a service that millions of people use world wide, excites you, take a look at jobs.netflix.com.
Netflix @ Recsys 2012
We are just a few days away from the 2012 ACM Recommender Systems Conference (#Recsys2012), that this year will take place in Dublin, Ireland. Over the years, Recsys has been and still is one of our favorite conferences, not only because of how relevant the area is to our business, but also because of its unique blend of academic research and industrial applications.
In fact, if you had to mention a single company that is identified with recommender systems and technologies, that would probably be Netflix. The Netflix Prize started a year before the first RecSys conference in Minneapolis, and it impacted Recommender Systems researchers and practitioners in many ways. So, it comes as no surprise that the relation between the conference and Netflix also goes a long way. Netflix has been involved in the conference throughout the years. And, this time in Dublin is not going to be any different. Not only is Netflix a proud sponsor of the conference, but you will also have the chance to listen to presentations and meet some of the people that make the wheels of the Netflix recommendations turn. Here are some of the highlights of Netflix' participation:
- Harald Steck and Xavier Amatriain are involved in organizing the workshop on "Recommender Utility Evaluation: Beyond RMSE". We believe that finding the right evaluation metrics is one of the key issues for recommender systems. This workshop will be a great event to not only discover the latest research in the area, but also to brainstorm and discuss on the issue of recsys evaluation.
- On that same workshop, you should not miss the keynote by our Director of Innovation Carlos Gomez-Uribe. The talk is entitled "Challenges and Limitations in the Offline and Online Evaluation of Recommender Systems: A Netflix Case Study". Carlos will give some insights into how we deal with online A/B and offline experimental metrics.
- On Tuesday, Xavier Amatriain will be giving a 90 minute tutorial on "Building industrial-scale real-world Recommender Systems". In this tutorial, he will talk about all those things that matter in a recommender system, and are usually outside of the academic focus. He will describe different ways that recommendations can be presented to the users, evaluation through A/B testing, data, and software architectures.
Post-mortem of October 22,2012 AWS degradation
On Monday, October 22nd, Amazon experienced a service degradation. It was highly publicized due to the fact that it took down many popular websites for multiple hours. Netflix however, while not completely unscathed, handled the outage with very little customer impact. We did some things well and could have done some things better, and we'd like to share with you the timeline of the outage from our perspective and some of the best practices we used to minimize customer impact.
Event Timeline
On Monday, just after 8:30am, we noticed that a couple of large websites that are hosted on Amazon were having problems and displaying errors. We took a survey of our own monitoring system and found no impact to our systems. At 10:40am, Amazon updated their status board showing degradation in the EBS service. Since Netflix focuses on making sure services can handle individual instance failure and since we avoid using EBS for data persistence, we still did not see any impact to our service.
At around 11am, some Netflix customers started to have intermittent problems. Since much of our client software is designed for resilience against intermittent server problems, most customers did not notice. At 11:15am, the problem became significant enough that we opened an internal alert and began investigating the cause of the problem. At the time, the issue was exhibiting itself as a network issue, not an EBS issue, which caused some initial confusion. We should have opened an alert earlier, which would have helped us narrow down the issue faster and let us remediate sooner.
When we were able to narrow down the network issue to a single zone, Amazon was also able to confirm that the degradation was limited to a single Availability Zone. Once we learned the impact was isolated to one AZ, we began evacuating the affected zone.
Due to previous single zone outages, one of the drills we run is a zone evacuation drill. Between the zone evacuation drill and our learnings from previous outages, the decision to evacuate the troubled zone was an easy one -- we expected it to be as quick and painless as it was during past drills. So that is what we did.
In the past we identified zone evacuations as a good way of solving problems isolated to a single zone and as such have made it easy in Asgard to do this with a few clicks per application. That preparation came in handy on Monday when we were able to evacuate the troubled zone in just 20 minutes and completely restore service to all customers.
Building for High Availability
We’ve developed a few patterns for improving the availability of our service.
Past outages and a mindset for designing in resiliency at the start have taught us a few best-practices about building high availability systems.
Redundancy
One of the most important things that we do is we build all of our software to operate in three Availability Zones. Right along with that is making each app resilient to a single instance failing. These two things together are what made zone evacuation easier for us. We stopped sending traffic to the affected zone and everything kept running. In some cases we needed to actually remove the instances from the zone, but this too was done with a just a few clicks to reconfigure the auto scaling group.
We apply the same three Availability Zone redundancy model to our Cassandra clusters. We configure all our clusters to use a replication factor of three, with each replica located in a different Availability Zone. This allowed Cassandra to handle the outage remarkably well. When a single zone became unavailable, we didn't need to do anything. Cassandra routed requests around the unavailable zone and when it recovered, the ring was repaired.
Simian Army
Everyone has the best intentions when building software. Good developers and architects think about error handling, corner cases, and building resilient systems. However, thinking about them isn’t enough. To ensure resiliency on an ongoing basis, you need to alway test your system’s capabilities and its ability to handle rare events. That’s why we built the Simian Army: Chaos Monkey to test resilience to instance failure, Latency Monkey to test resilience to network and service degradation, and Chaos Gorilla to test resilience to zone outage. A future improvement we want to make is expanding the Chaos Gorilla to make zone evacuation a one-click operation, making the decision even easier. Once we build up our muscles further, we want to introduce Chaos Kong to test resilience to a complete regional outage.
Easy tooling & Automation
The last thing that made zone evacuation an easy decision is our cloud management tool, known as Asgard . With just a couple of clicks, service owners are able to stop the traffic to the instances or delete the instances as necessary.
Embracing Mistakes
Every time we have an outage, we make sure that we have an incident review. The purpose of these reviews is not to place blame, but to learn what we can do better. After each incident we put together a detailed timeline and then ask ourselves, “What could we have done better? How could we lessen the impact next time? How could we have detected the problem sooner?” We then take those answers and try to solve classes of problems instead of just the most recent problem. This is how we develop our best practices.
Conclusion
We weathered this last AWS outage quite well and learned a few more lessons to improve on. With each outage, we look for opportunities to improve both the way our system is built and the way we detect and react to failure. While we feel we’ve built a highly available and reliable service, there’s always room to grow and improve.
If you like thinking about high availability and how to build more resilient systems, we have many openings throughout the company, including a few Site Reliability Engineering positions.
Governator - Lifecycle and Dependency Injection
Governator
- Classpath scanning and automatic binding
- Lifecycle management
- Configuration to field mapping
- Field validation
- Parallelized object warmup
- Lazy singleton support
- Generic binding annotations
Why the name Governator? It Governs the bootstrapping process and all my OSS projects end in "tor" (see: Curator and Exhibitor) - also it makes me laugh ;)
What is Dependency Injection?
As has been described on the Netflix Tech Blog and elsewhere, Netflix utilizes a highly distributed architecture comprised of many individual service types and many shared libraries. The Netflix Platform Team is responsible for making those libraries and services easy to configure and use. As the number of these libraries and services has grown, our existing methods have reached their limits. That is why we're moving to a Dependency Injection based system. This system will make it much easier for teams to use common libraries without having to worry about initialization and object lifecycle details.
What is Object Lifecycle?
Google Guice
introduction of Dependency Injection much easier.
Summary
Edda - Learn the Stories of Your Cloud Deployments
Operating "in the cloud" has its challenges, and one of those challenges is that nothing is static. Virtual host instances are constantly coming and going, IP addresses can get reused by different applications, and firewalls suddenly appear as security configurations are updated. At Netflix we needed something to help us keep track of our ever-shifting environment within Amazon Web Services (AWS). Our solution is Edda.
Today we are proud to announce that the source code for Edda is open and available.
What is Edda?
Edda is a service that polls your AWS resources via AWS APIs and records the results. It allows you to quickly search through your resources and shows you how they have changed over time.
Previously this project was known within Netflix as Entrypoints (and mentioned in some blog posts), but the name was changed as the scope of the project grew. Edda (meaning "a tale of Norse mythology"), seemed appropriate for the new name, as our application records the tales of Asgard.
Why did we create Edda?
Dynamic Querying
At Netflix we need to be able to quickly query and analyze our AWS resources with widely varying search criteria. For instance, if we see a host with an EC2 hostname that is causing problems on one of our API servers then we need to find out what that host is and what team is responsible, Edda allows us to do this. The APIs AWS provides are fast and efficient but limited in their querying ability. There is no way to find an instance by the hostname, or find all instances in a specific Availability Zone without first fetching all the instances and iterating through them.
With Edda's REST APIs we can use matrix arguments to find the resources that we are looking for. Furthermore, we can trim out unnecessary data in the responses with Field Selectors.
Example: Find any instances that have ever had a specific public IP address:
$ curl "http://edda/api/v2/view/instances;publicIpAddress=1.2.3.4;_since=0"Now find out what AutoScalingGroup the instances were tagged with:
["i-0123456789","i-012345678a","i-012345678b"]
$ export INST_API=http://edda/api/v2/view/instances
$ curl "$INST_API;publicIpAddress=1.2.3.4;_pp;_since=0;_expand:(instanceId,tags)"
[
{
"instanceId" : "i-0123456789",
"tags" : [
{
"key" : "aws:autoscaling:groupName",
"value" : "app1-v123"
}
]
},
{
"instanceId" : "i-012345678a",
"tags" : [
{
"key" : "aws:autoscaling:groupName",
"value" : "app2-v123"
}
]
},
{
"instanceId" : "i-012345678b",
"tags" : [
{
"key" : "aws:autoscaling:groupName",
"value" : "app3-v123"
}
]
}
]
History/Changes
When trying to analyze causes and impacts of outages we have found the historical data stored in Edda to be very valuable. Currently AWS does not provide APIs that allow you to see the history of your resources, but Edda records each AWS resource as versioned documents that can be recalled via the REST APIs. The "current state" is stored in memory, which allows for quick access. Previous resource states and expired resources are stored in MongoDB (by default), which allows for efficient retrieval. Not only can you see how resources looked in the past, but you can also get unified diff output quickly and see all the changes a resource has gone through.
For example, this shows the most recent change to a security group:
$ curl "http://edda/api/v2/aws/securityGroups/sg-0123456789;_diff;_all;_limit=2"
--- /api/v2/aws.securityGroups/sg-0123456789;_pp;_at=1351040779810
+++ /api/v2/aws.securityGroups/sg-0123456789;_pp;_at=1351044093504
@@ -1,33 +1,33 @@
{
"class" : "com.amazonaws.services.ec2.model.SecurityGroup",
"description" : "App1",
"groupId" : "sg-0123456789",
"groupName" : "app1-frontend",
"ipPermissions" : [
{
"class" : "com.amazonaws.services.ec2.model.IpPermission",
"fromPort" : 80,
"ipProtocol" : "tcp",
"ipRanges" : [
"10.10.1.1/32",
"10.10.1.2/32",
+ "10.10.1.3/32",
- "10.10.1.4/32"
],
"toPort" : 80,
"userIdGroupPairs" : [ ]
}
],
"ipPermissionsEgress" : [ ],
"ownerId" : "2345678912345",
"tags" : [ ],
"vpcId" : null
}
High Level Architecture
Edda is a Scala application that can both run on a single instance or scale up to many instances running behind a load balancer for high availability. The data store that Edda currently supports is MongoDB, which is also versatile enough to run on either a single instance along with the Edda service, or be grown to include large replication sets. When running as a cluster, Edda will automatically select a leader which then does all the AWS polling (by default every 60 seconds) and persists the data. The other secondary servers will be refreshing their in-memory records (by default every 30 seconds) and handling REST requests.
Currently only MongoDB is supported for the persistence layer, but we are analyzing alternatives. MongoDB supports JSON documents and allows for advanced query options, both of which are necessary for Edda. However, as our previous blogs have indicated, Netflix is heavily invested in Cassandra. We are therefore looking at some options for advance query services that can work in conjunction with Cassandra.
Edda was designed to allow for easily implementing custom crawlers to track collections of resources other than those of AWS. In the near future we will be releasing some examples we have implemented which track data from AppDynamics, and others which track our Asgard applications and clusters.
Configuration
There are many configuration options for Edda. It can be configured to poll a single AWS region (as we run it here) or to poll across multiple regions. If you have multiple AWS accounts (ie. test and prod), Edda can be configured to poll both from the same instance. Edda currently polls 15 different resource types within AWS. Each collection can be individually enabled or disabled. Additionally, crawl frequency and cache refresh rates can all be tweaked.
Coming up
In the near future we are planning to release some new collections for Edda to monitor. The first will be APIs that allow us to pull details about application health and traffic patterns out of AppDynamics. We also plan to release APIs that track our Asgard application and cluster resources.
Summary
We hope you find Edda to be a useful tool. We'd appreciate any and all feedback on it. Are you interested in working on great open source software? Netflix is hiring! http://jobs.netflix.com
Edda Links
Announcing Blitz4j - a scalable logging framework
We are proud to announce Blitz4j , a critical component of the Netflix logging infrastructure that helps Netflix achieve high volume logging without affecting scalability of the applications.
What is Blitz4j?
Blitz4j is a logging framework built on top of log4j to reduce multithreaded contention and enable highly scalable logging without affecting application performance characteristics.
Why is scalable logging important?
Logging is a critical part of any application infrastructure. At Netflix, we collect data for monitoring, business intelligence reporting etc. There is also a need to turn on finer grain of logging level for debugging customer issues.
History of Blitz4j
At Netflix, log4j has been used as a logging framework for a few years. It had worked fine for us, until the point where there was a real need to log lots of data. When our traffic increased and when the need for per-instance logging went up, log4j's frailties started to get exposed.
Problems with Log4j
public
void callAppenders(LoggingEvent event) {
int writes = 0;
for(Category c = this; c != null; c=c.parent) {
// Protected against simultaneous call to addAppender, removeAppender,...
synchronized(c) {
if(c.aai != null) {
writes += c.aai.appendLoopOnAppenders(event);
}
if(!c.additive) {
break;
}
}
}
if(writes == 0) {
repository.emitNoAppenderWarning(this);
}
}
public
synchronized
void doAppend(LoggingEvent event) {
if(closed) {
LogLog.error("Attempted to append to closed appender named ["+name+"].");
return;
}
if(!isAsSevereAsThreshold(event.getLevel())) {
return;
}
Filter f = this.headFilter;
FILTER_LOOP:
while(f != null) {
switch(f.decide(event)) {
case Filter.DENY: return;
case Filter.ACCEPT: break FILTER_LOOP;
case Filter.NEUTRAL: f = f.getNext();
}
}
this.append(event);
}
- Reset and empty out all current log4j configurations
- Load all configurations including new configurations
public
void shutdown() {
Logger root = getRootLogger();
// begin by closing nested appenders
root.closeNestedAppenders();
synchronized(ht) {
Enumeration cats = this.getCurrentLoggers();
while(cats.hasMoreElements()) {
Logger c = (Logger) cats.nextElement();
c.closeNestedAppenders();
}
Why Blitz4j?
- Remove all critical synchronizations with concurrent data structures.
- Extreme configurability in terms of in-memory buffer and worker threads
- More isolation of application threads from logging threads by replacing the wait-notify model with an executor pool model.
- Better handling of log messages during log storms with configurable summary.
- Ability to dynamically configure log4j levels for debugging production problems without affecting the application performance.
- Automatic conversion of any log4j appender to the asynchronous model statically or at runtime.
- Realtime metrics regarding performance using Servo and dynamic configurability using Archaius.
Why not use LogBack?
Blitz4j Performance
In a steady state, the latter is atleast 3 times more expensive than blitz4j. There are numerous spikes that happen with the log4j implementation that are due to the synchronizations talked about earlier.
Other things we observed:
Blitz4j Source
Blitz4j Wiki
Introducing Hystrix for Resilience Engineering

In a distributed environment, failure of any given service is inevitable. Hystrix is a library designed to control the interactions between these distributed services providing greater tolerance of latency and failure. Hystrix does this by isolating points of access between the services, stopping cascading failures across them, and providing fallback options, all of which improve the system's overall resiliency.
Hystrix evolved out of resilience engineering work that the Netflix API team began in 2011. Over the course of 2012, Hystrix continued to evolve and mature, eventually leading to adoption across many teams within Netflix. Today tens of billions of thread-isolated and hundreds of billions of semaphore-isolated calls are executed via Hystrix every day at Netflix and a dramatic improvement in uptime and resilience has been achieved through its use.
The following links provide more context around Hystrix and the challenges that it attempts to address:
- Making the Netflix API More Resilient
- Fault Tolerance in a High Volume, Distributed System
- Performance and Fault Tolerance for the Netflix API
Getting Started
Hystrix is available on GitHub at http://github.com/Netflix/Hystrix
Full documentation is available at http://github.com/Netflix/Hystrix/wiki including Getting Started, How To Use, How It Works and Operations examples of how it is used in a distributed system.
You can get and build the code as follows:
$ git clone git@github.com:Netflix/Hystrix.git
$ cd Hystrix/
$ ./gradlew build
Coming Soon
In the near future we will also be releasing the real-time dashboard for monitoring Hystrix as we do at Netflix:

We hope you find Hystrix to be a useful library. We'd appreciate any and all feedback on it and look forward to fork/pulls and other forms of contribution as we work on its roadmap.
Are you interested in working on great open source software? Netflix is hiring!
http://jobs.netflix.com
Fault Tolerance in a High Volume, Distributed System
In an earlier post by Ben Schmaus, we shared the principles behind our circuit-breaker implementation. In that post, Ben discusses how the Netflix API interacts with dozens of systems in our service-oriented architecture, which makes the API inherently more vulnerable to any system failures or latencies underneath it in the stack. The rest of this post provides a more technical deep-dive into how our API and other systems isolate failure, shed load and remain resilient to failures.
Fault Tolerance is a Requirement, Not a Feature
The Netflix API receives more than 1 billion incoming calls per day which in turn fans out to several billion outgoing calls (averaging a ratio of 1:6) to dozens of underlying subsystems with peaks of over 100k dependency requests per second.
This all occurs in the cloud across thousands of EC2 instances.
Intermittent failure is guaranteed with this many variables, even if every dependency itself has excellent availability and uptime.
Without taking steps to ensure fault tolerance, 30 dependencies each with 99.99% uptime would result in 2+ hours downtime/month (99.99%30 = 99.7% uptime = 2+ hours in a month).
When a single API dependency fails at high volume with increased latency (causing blocked request threads) it can rapidly (seconds or sub-second) saturate all available Tomcat (or other container such as Jetty) request threads and take down the entire API.
Thus, it is a requirement of high volume, high availability applications to build fault tolerance into their architecture and not expect infrastructure to solve it for them.
Netflix DependencyCommand Implementation
The service-oriented architecture at Netflix allows each team freedom to choose the best transport protocols and formats (XML, JSON, Thrift, Protocol Buffers, etc) for their needs so these approaches may vary across services.
In most cases the team providing a service also distributes a Java client library.
Because of this, applications such as API in effect treat the underlying dependencies as 3rd party client libraries whose implementations are "black boxes". This in turn affects how fault tolerance is achieved.
In light of the above architectural considerations we chose to implement a solution that uses a combination of fault tolerance approaches:
- network timeouts and retries
- separate threads on per-dependency thread pools
- semaphores (via a tryAcquire, not a blocking call)
- circuit breakers
The Netflix DependencyCommand implementation wraps a network-bound dependency call with a preference towards executing in a separate thread and defines fallback logic which gets executed (step 8 in flow chart below) for any failure or rejection (steps 3, 4, 5a, 6b below) regardless of which type of fault tolerance (network or thread timeout, thread pool or semaphore rejection, circuit breaker) triggered it.
![]() |
Click to enlarge |
We decided that the benefits of isolating dependency calls into separate threads outweighs the drawbacks (in most cases). Also, since the API is progressively moving towards increased concurrency it was a win-win to achieve both fault tolerance and performance gains through concurrency with the same solution. In other words, the overhead of separate threads is being turned into a positive in many use cases by leveraging the concurrency to execute calls in parallel and speed up delivery of the Netflix experience to users.
Thus, most dependency calls now route through a separate thread-pool as the following diagram illustrates:
If a dependency becomes latent (the worst-case type of failure for a subsystem) it can saturate all of the threads in its own thread pool, but Tomcat request threads will timeout or be rejected immediately rather than blocking.
![]() |
Click to enlarge |
In addition to the isolation benefits and concurrent execution of dependency calls we have also leveraged the separate threads to enable request collapsing (automatic batching) to increase overall efficiency and reduce user request latencies.
Semaphores are used instead of threads for dependency executions known to not perform network calls (such as those only doing in-memory cache lookups) since the overhead of a separate thread is too high for these types of operations.
We also use semaphores to protect against non-trusted fallbacks. Each DependencyCommand is able to define a fallback function (discussed more below) which is performed on the calling user thread and should not perform network calls. Instead of trusting that all implementations will correctly abide to this contract, it too is protected by a semaphore so that if an implementation is done that involves a network call and becomes latent, the fallback itself won't be able to take down the entire app as it will be limited in how many threads it will be able to block.
Despite the use of separate threads with timeouts, we continue to aggressively set timeouts and retries at the network level (through interaction with client library owners, monitoring, audits etc).
The timeouts at the DependencyCommand threading level are the first line of defense regardless of how the underlying dependency client is configured or behaving but the network timeouts are still important otherwise highly latent network calls could fill the dependency thread-pool indefinitely.
The tripping of circuits kicks in when a DependencyCommand has passed a certain threshold of error (such as 50% error rate in a 10 second period) and will then reject all requests until health checks succeed.
This is used primarily to release the pressure on underlying systems (i.e. shed load) when they are having issues and reduce the user request latency by failing fast (or returning a fallback) when we know it is likely to fail instead of making every user request wait for the timeout to occur.
How do we respond to a user request when failure occurs?
In each of the options described above a timeout, thread-pool or semaphore rejection, or short-circuit will result in a request not retrieving the optimal response for our customers.
An immediate failure ("fail fast") throws an exception which causes the app to shed load until the dependency returns to health. This is preferable to requests "piling up" as it keeps Tomcat request threads available to serve requests from healthy dependencies and enables rapid recovery once failed dependencies recover.
However, there are often several preferable options for providing responses in a "fallback mode" to reduce impact of failure on users. Regardless of what causes a failure and how it is intercepted (timeout, rejection, short-circuited etc) the request will always pass through the fallback logic (step 8 in flow chart above) before returning to the user to give a DependencyCommand the opportunity to do something other than "fail fast".
Some approaches to fallbacks we use are, in order of their impact on the user experience:
- Cache: Retrieve data from local or remote caches if the realtime dependency is unavailable, even if the data ends up being stale
- Eventual Consistency: Queue writes (such as in SQS) to be persisted once the dependency is available again
- Stubbed Data: Revert to default values when personalized options can't be retrieved
- Empty Response ("Fail Silent"): Return a null or empty list which UIs can then ignore
Example Use Case
Following is an example of how threads, network timeouts and retries combine:
The above diagram shows an example configuration where the dependency has no reason to hit the 99.5th percentile and thus cuts it short at the network timeout layer and immediately retries with the expectation to get median latency most of the time, and accomplish this all within the 300ms thread timeout.
If the dependency has legitimate reasons to sometimes hit the 99.5th percentile (i.e. cache miss with lazy generation) then the network timeout will be set higher than it, such as at 325ms with 0 or 1 retries and the thread timeout set higher (350ms+).
The threadpool is sized at 10 to handle a burst of 99th percentile requests, but when everything is healthy this threadpool will typically only have 1 or 2 threads active at any given time to serve mostly 40ms median calls.
When configured correctly a timeout at the DependencyCommand layer should be rare, but the protection is there in case something other than network latency affects the time, or the combination of connect+read+retry+connect+read in a worst case scenario still exceeds the configured overall timeout.
The aggressiveness of configurations and tradeoffs in each direction are different for each dependency.
Configurations can be changed in realtime as needed as performance characteristics change or when problems are found all without risking the taking down of the entire app if problems or misconfigurations occur.
Conclusion
The approaches discussed in this post have had a dramatic effect on our ability to tolerate and be resilient to system, infrastructure and application level failures without impacting (or limiting impact to) user experience.
Despite the success of this new DependencyCommand resiliency system over the past 8 months, there is still a lot for us to do in improving our fault tolerance strategies and performance, especially as we continue to add functionality, devices, customers and international markets.
If these kinds of challenges interest you, the API team is actively hiring:
JMeter Plugin for Cassandra
A number of previous blogs have discussed our adoption of Cassandra as a NoSQL solution in the cloud. We now have over 55 Cassandra clusters in the cloud and are moving our source of truth from our Datacenter to these Cassandra clusters. As part of this move we have not only contributed to Cassandra itself but developed software to ease its deployment and use. It is our plan to open source as much of this software as possible.
We recently announced the open sourcing of Priam, which is a co-process that runs alongside Cassandra on every node to provide backup and recovery, bootstrapping, token assignment, configuration management and a RESTful interface to monitoring and metrics. In January we also announced our Cassandra Java client Astyanax which is built on top of Thrift and provides lower latency, reduced latency variance, and better error handling.
At Netflix we have recently started to standardize our load testing across the fleet using Apache JMeter. As Cassandra is a key part of our infrastructure that needs to be tested we developed a JMeter plugin for Cassandra. In this blog we discuss the plugin and present performance data for Astyanax vs Thrift collected using this plugin.
Cassandra JMeter Plugin
JMeter allows us to customize our test cases based on our application logic/datamodel. The Cassandra JMeter plugin we are releasing today is described on the github wiki here. It consists of a jar file that is placed in JMeter's lib/ext directory. The instructions to build and install the jar file are here.
An example screenshot is shown below.

Benchmark Setup
We set up a simple 6-node Cassandra cluster using EC2 m2.4xlarge instances, and the following schema
create keyspace MemberKeySp
with placement_strategy =
'NetworkTopologyStrategy'
and strategy_options = [{us-east :
3
}]
and durable_writes =
true
;
use MemberKeySp;
create column family Customer
with column_type =
'Standard'
and comparator =
'UTF8Type'
and default_validation_class =
'BytesType'
and key_validation_class =
'UTF8Type'
and rows_cached =
0.0
and keys_cached =
100000.0
and read_repair_chance =
0.0
and comment =
'Customer Records'
;
Six million rows were then inserted into the cluster with a replication factor 3. Each row has 19 columns of simple ascii data. Total data set is 2.9GB per node so easily cacheable in our instances which have 68GB of memory. We wanted to test the latency of the client implementation using a single Get Range Slice operation ie 100% Read only. Each test was run twice to ensure the data was indeed cached, confirmed with iostat. One hundred JMeter threads were used to apply the load with 100 connections from JMeter to each node of Cassandra. Each JMeter thread therefore has at least 6 connections to choose from when sending it's request to Cassandra.
Every Cassandra JMeter Thread Group has a Config Element called CassandraProperties which contains clientType amongst other properties. For Astyanax clientType is set t0 com.netflix.jmeter.connections.a6x.AstyanaxConnection, for Thrift com.netflix.jmeter.connections.thrift.ThriftConnection.
Token Aware is the default JMeter setting. If you wish to experiment with other settings create a properties file, cassandra.properties, in the JMeter home directory with properties from the list below.
astyanax.connection.discovery=
astyanax.connection.pool=
astyanax.connection.latency.stategy=
Results
Transaction throughput
This graph shows the throughput at 5 second intervals for the Token Aware client vs the Thrift client. Token aware is consistently higher than Thrift and its average is 3% better throughput

Average Latency
JMeter reports response times to millisecond granularity. The Token Aware implementation responds in 2ms the majority of the time with occasional 3ms periods, the average is 2.29ms. The Thrift implementation is consistently at 3ms. So Astyanax has about a 30% better response time than raw Thrift implementation without token aware connection pool.
The plugin provides a wide range of samplers for Put, Composite Put, Batch Put, Get, Composite Get, Range Get and Delete. The github wiki has examples for all these scenarios including jmx files to try. Usually we develop the test scenario using the GUI on our laptops and then deploy to the cloud for load testing using the non-GUI version. We often deploy on a number of drivers in order to apply the required level of load.
The data for the above benchmark was also collected using a tool called casstat which we are also making available in the repository. Casstat is a bash script that calls other tools at regular intervals, compares the data with its previous sample, normalizes it on a per second basis and displays the pertinent data on a single line. Under the covers casstat uses
- Cassandra nodetool cfstats to get Column Family performance data
- nodetool tpstats to get internal state changes
- nodetool cfhistograms to get 95th and 99th percentile response times
- nodetool compactionstats to get details on number and type of compactions
- iostat to get disk and cpu performance data
- ifconfig to calculate network bandwidth
An example output is below (note some fields have been removed and abbreviated to reduce the width)
Epoch Rds/s RdLat ... %user %sys %idle .... md0r/s w/s rMB/s wMB/s NetRxK NetTxK Percentile Read Write Compacts
133
...
5657
0.085
...
7.74
10.09
81.73
...
0.00
2.00
0.00
0.05
9083
63414
99th
0.179
ms 95th
0.14
ms 99th
0.00
ms 95th
0.00
ms Pen/
0
133
...
5635
0.083
...
7.65
10.12
81.79
...
0.00
0.30
0.00
0.00
9014
62777
99th
0.179
ms 95th
0.14
ms 99th
0.00
ms 95th
0.00
ms Pen/
0
133
...
5615
0.085
...
7.81
10.19
81.54
...
0.00
0.60
0.00
0.00
9003
62974
99th
0.179
ms 95th
0.14
ms 99th
0.00
ms 95th
0.00
ms Pen/
0
We merge the casstat data from each Cassandra node and then use gnuplot to plot throughput etc.
The Cassandra JMeter plugin has become a key part of our load testing environment. We hope the wider community also finds it useful.
AWS Re:Invent was Awesome!
There was a very strong Netflix presence at AWS Re:Invent in Las Vegas this week, from Reed Hastings appearing in the opening keynote, to a packed series of ten talks by Netflix management and engineers, and our very own expo booth. The event was a huge success, over 6000 attendees, great new product and service announcements, very well organized and we are looking forward to doing it again next year.
Wednesday Morning Keynote
The opening keynote with Andy Jassy contains an exciting review of the Curiosity Mars landing showing how AWS was used to feed information and process images for the watching world. Immediately afterwards (at 36'40") Andy sits down with Reed Hastings.Reed talks about taking inspiration from Nicholas Carr's book "the Big Switch" to realize that cloud would be the future, and over the last four years, Netflix has moved from initial investigation to having deployed about 95% of our capacity on AWS. By the end of next year Reed aims to be 100% on AWS and to be the biggest business entirely hosted on AWS apart from Amazon Retail. Streaming in 2008 was around a million hours a month, now it's over a billion hours a month. A thousandfold increase is over four years is difficult to plan for, and while Netflix took the risk of being an early adopter of AWS in 2009, we were avoiding a bigger risk of being unable to build out capacity for streaming ourselves. "The key is that now we're on a cost curve and an architecture... that as all of this room does more with AWS we benefit, by that collective effect that gets you to scale and brings prices down."
Andy points out that Amazon Retail competes with Netflix in the video space, and asks what gave Reed the confidence to move to AWS. Reed replies that Jeff Bezos and Andy have both been very clear that AWS is a great business that should be run independently and the more that Amazon Retail competes with Netflix, the better symbol Netflix is that it's safe to run on AWS. Andy replies "Netflix is every bit as important a customer of AWS as Amazon Retail, and that's true for all of our external customers".
The discussion moves onto the future of cloud, and Reed points out that as wonderful as AWS is, we are still in the assembly language phase of cloud computing. Developers shouldn't have to be picking individual instance types, just as they no longer need to worry about CPU register allocation because compilers handle that for them. Over the coming years, the cloud will add the ability to move live instances between instance types. We can see that this is technically possible because VMware does that today with VMotion, but bringing this capability to public cloud would allow cost optimization, improvements in bi-sectional bandwidth and great improvements in efficiency. There are great technical challenges to do this seamlessly at scale, and Reed wished Andy well in tackling these hard problems in the coming years.
The second area of future development is consumer devices that are touch based, understand voice commands and are backed by ever more powerful cloud based services. For Netflix, the problem is to pick the best movies to show on a small screen for a particular person at that point in time, from a huge catalog of TV shows and movies. The ability to cheaply throw large amounts of compute power at this ranking problem lets Netflix experiment rapidly to improve the customer experience.
In the final exchange, Andy asks what advice he can give to the audience, and Reed says to build products that you find exciting, and to watch House of Cards on Netflix on February 1st next year.
Next Andy talks about the rate at which AWS introduces and updates products, from 61 in 2010, to 82 in 2011 to 158 in 2012. He then went on to introduce AWS Redshift, a low cost data warehouse as a service that we are keen to evaluate as we replace our existing datacenter based data warehouse with a cloud based solution.
Along with presentations from NASDAQ and SAP, Andy finished up with examples of mission critical applications that are running on AWS, including including a huge diagram showing the Obama For America election back end, consisting of over 200 applications. We were excited to find out that the OFA tech team were using the Netflix open source management console Asgard to manage their deployments on AWS, and to see the Asgard icon scattered across this diagram. During the conference we met the OFA team and many other AWS end users who have also started using various @NetflixOSS projects.
Thursday Morning Keynote
The second day keynote with Werner Vogels started off with Werner talking about architecture. Starting around 43 minutes in he describes some 21st Century Architectural patterns which are being used by Amazon.com, AWS itself, and are also very similar to the Netflix architectural practices. After a long demo from Matt Wood that used the AWS Console to laboriously do what Asgard does in a few clicks there is an interesting description of how S3 was designed for resilience and scalability by Alyssa Henry, the VP of Storage Services for AWS.Werner returns to talk about some more architectural principles, a customer talk from Animoto, then announces two new high end instance types that will become available in the coming weeks. The cr1.8xlarge has 240GB of RAM and two 120GB solid state disks, it's ideal for running in memory analytics. The hs1.8xlarge has 114GB of RAM and twenty four 2TB hard drives in the instance, it's ideal for running data warehouses, and is clearly the raw back end instance behind the Redshift data warehouse product announced the day before. Finally he discussed data driven architectures and introduces AWS Data Pipeline, then Matt Wood comes on again to do a demo.
Thursday Afternoon Fireside Chat
The final keynote, fireside chat with Werner Vogels and Jeff Bezos has interesting discussions of lean start-up principles and the nature of innovation. At 29'50" they discuss Netflix and the issues of competition between Amazon Prime and Netflix. Jeff says there is no issue, "We bust our butt every day for Netflix", and Werner says the way AWS works is the same for everyone, there are no special cases for Amazon.com, Netflix or anyone else.The discussion continues with an introduction to the 10,000 year clock and the Blue Origin vertical take off and vertical landing spaceship that Jeff is also involved in as side projects.
Netflix in the Expo Hall and @NetflixOSS
More Coming Soon
Wed 1:00-1:45 Coburn Watson Optimizing Costs with AWS Wed 2:05-2:55 Kevin McEntee Netflix’s Transcoding Transformation Wed 3:25-4:15 Neil Hunt / Yury Izrailevsky Netflix: Embracing the Cloud Wed 4:30-5:20 Adrian Cockcroft High Availability Architecture at Netflix Thu 10:30-11:20 Jeremy Edberg Rainmakers – Operating Clouds Thu 11:35-12:25 Kurt Brown Data Science with Elastic Map Reduce (EMR) Thu 11:35-12:25 Jason Chan Security Panel: Learn from CISOs working with AWS Thu 3:00-3:50 Adrian Cockcroft Compute & Networking Masters Customer Panel Thu 3:00-3:50 Ruslan Meshenberg/Gregg Ulrich Optimizing Your Cassandra Database on AWS Thu 4:05-4:55 Ariel Tseitlin Intro to Chaos Monkey and the Simian Army |
Videos of the Netflix talks at AWS Re:Invent
Most of the talks and panel sessions at AWS Re:Invent were recorded, but there are so many sessions that it's hard to find the Netflix ones. Here's a link to all of the videos posted by AWS that mention Netflix: http://www.youtube.com/user/AmazonWebServices/videos?query=netflix
They are presented below in what seems like a natural order that tells the Netflix story, starting with the migration and video encoding talks, then talking about availability, Cassandra based storage, "big data" and security architecture, ending up with operations and cost optimization. Unfortunately a talk on Chaos Monkey had technical issues with the recording and is not available.
Embracing the Cloud
Presented by Neil Hunt - Chief Product Officer, and Yury Israilevsky - VP Cloud and Platform Engineering.Join the product and cloud computing leaders of Netflix to discuss why and how the company moved to Amazon Web Services. From early experiments for media transcoding, to building the operational skills to optimize costs and the creation of the Simian Army, this session guides business leaders through real world examples of evaluating and adopting cloud computing.
Slides: http://www.slideshare.net/AmazonWebServices/ent101-embracing-the-cloud-final
Netflix's Encoding Transformation
Presented by Kevin McEntee, VP Digital Supply Chain.Netflix designed a massive scale cloud based media transcoding system from scratch for processing professionally produced studio content. We bucked the common industry trend of vertical scaling and, instead, designed a horizontally scaled elastic system using AWS to meet the unique scale and time constraints of our business. Come hear how we designed this system, how it continues to get less expensive for Netflix, and how AWS represents a transformative opportunity in the wider media owning industry.
Slides: http://www.slideshare.net/AmazonWebServices/med202-netflixtranscodingtransformation
Highly Available Architecture at Netflix
Presented by Adrian Cockcroft (@adrianco) Director of ArchitectureThis talk describes a set of architectural patterns that support highly available services that are also scalable, low cost, low latency and allow agile continuous deployment development practices. The building blocks for these patterns have been released at netflix.github.com as open source projects for others to use.
Slides: http://www.slideshare.net/AmazonWebServices/arc203-netflixha
Optimizing Your Cassandra Database on AWS
Presented by Ruslan Meshenberg - Director of Cloud Platform Engineering and Gregg Ulrich - Cassandra DevOps ManagerFor a service like Netflix, data is crucial. In this session, Netflix details how they chose and leveraged Cassandra, a highly-available and scalable open source key/value store. In this presentation they discuss why they chose Cassandra, the tools and processes they developed to quickly and safely move data into AWS without sacrificing availability or performance, and best practices that help Cassandra work well in AWS.
Slides: http://www.slideshare.net/AmazonWebServices/dat202-cassandra
Data Science with Elastic Map Reduce
In this talk, we dive into the Netflix Data Science & Engineering architecture. Not just the what, but also the why. Some key topics include the big data technologies we leverage (Cassandra, Hadoop, Pig + Python, and Hive), our use of Amazon S3 as our central data hub, our use of multiple persistent Amazon Elastic MapReduce (EMR) clusters, how we leverage the elasticity of AWS, our data science as a service approach, how we make our hybrid AWS / data center setup work well, and more.
Slides: http://www.slideshare.net/AmazonWebServices/bdt303-netflix-data-science-with-emr
Security Panel
Featuring Jason Chan, Director of Cloud Security Architecture.Learn from fellow customers, including Jason Chan of Netflix, Khawaja Shams of NASA, and Rahul Sharma of Averail, who have leveraged the AWS secure platform to build business critical applications and services. During this panel discussion, our panelists share their experiences utilizing the AWS platform to operate some of the world’s largest and most critical applications.
How Netflix Operates Clouds for Maximum Freedom and Agility
Presented by Jeremy Edberg (@jedberg), Reliability ArchitectIn this session, learn how Netflix has embraced DevOps and leveraged all that Amazon has to offer to allow our developers maximum freedom and agility.
Slides: http://www.slideshare.net/AmazonWebServices/rmg202-devops-atnetflixreinvent
Optimizing Costs with AWS
Presented by Coburn Watson - Manager, Cloud Performance EngineeringFind out how Netflix, one of the largest, most well-known and satisfied AWS customers, develop and run their applications efficiently on AWS. The manager of the Netflix Cloud Performance Engineering team outlines a common-sense approach to effectively managing AWS usage costs while giving the engineers unconstrained operational freedom.
Slides: http://www.slideshare.net/cpwatson/aws-reinvent-optimizing-costs-with-aws
Intro to Chaos Monkey and the Simian Army
Presented by Ariel Tsetlin - Director of Cloud SolutionsWhy were the monkeys created, what makes up the Simian Army, and how do we run and manage them in the production environment.
Slides: http://www.slideshare.net/AmazonWebServices/arc301netflixsimianarmy
Unfortunately the video recording had technical problems.
In Closing...
Hystrix Dashboard + Turbine Stream Aggregator
Two weeks ago we introduced Hystrix, a library for engineering resilience into distributed systems. Today we're open sourcing the Hystrix dashboard application, as well as a new companion project called Turbine that provides low latency event stream aggregation.

The Hystrix dashboard has significantly improved our operations by reducing discovery and recovery times during operational events. The duration of most production incidents (already less frequent due to Hystrix) is far shorter, with diminished impact, because we are now able to get realtime insights (1-2 second latency) into system behavior.
The following snapshot shows six HystrixCommands being used by the Netflix API. Under the hood of this example dashboard, Turbine is aggregating data from 581 servers into a single stream of metrics supporting the dashboard application, which in turn streams the aggregated data to the browser for display in the UI.

When a circuit is failing then it changes colors (gradient from green through yellow, orange and red) such as this:

The diagram below shows one "circuit" from the dashboard along with explanations of what all of the data represents.
We've purposefully tried to pack a lot of information into the dashboard so that engineers can quickly consume and correlate data.

The following video shows the dashboard operating with data from a Netflix API cluster:
The Turbine deployment at Netflix connects to thousands of Hystrix-enabled servers and aggregates realtime streams from them. Netflix uses Turbine with a Eureka plugin that handles instances joining and leaving clusters (due to autoscaling, red/black deployments, or just being unhealthy).
Our alerting systems have also started migrating to Turbine-powered metrics streams so that in one minute of data there are dozens or hundreds of points of data for a single metric. This high resolution of metrics data makes for better and faster alerting.
The Hystrix dashboard can be used either to monitor an individual instance without Turbine or in conjunction with Turbine to monitor multi-machine clusters:

Turbine can be found on Github at: https://github.com/Netflix/Turbine
Dashboard documentation is at: https://github.com/Netflix/Hystrix/wiki/Dashboard
We expect people to want to customize the UI so the javascript modules have been implemented in a way that they can easily be used standalone in existing dashboards and applications. We also expect different perspectives on how to visualize and represent data and look forward to contributions back to both Hystrix and Turbine.
We are always looking for talented engineers so if you're interested in this type of work contact us via jobs.netflix.com.
Complexity In The Digital Supply Chain
This trip reinforced for me that today’s Digital Supply Chain for the streaming video industry is awash in accidental complexity. Fortunately the incentives to fix the supply chain are beginning to emerge. Netflix needs to innovate on the supply chain so that we can effectively increase licensing spending to create an outstanding member experience. The content owning studios need to innovate on the supply chain so that they can develop an effective, permanent, and growing sales channel for digital distribution customers like Netflix. Finally, post production houses have a fantastic opportunity to pivot their businesses to eliminate this complexity for their content owning customers.
Everyone loves Star Trek because it paints a picture of a future that many of us see as fantastic and hopefully inevitable. Warp factor 5 space travel, beamed transport over global distances, and automated food replicators all bring simplicity to the mundane aspects of living and free up the characters to pursue existence on a higher plane of intellectual pursuits and exploration.
The equivalent of Star Trek for the Digital Supply Chain is an online experience for content buyers where they browse available studio content catalogs and make selections for content to license on behalf of their consumers. Once an ‘order’ is completed on this system, the materials (video, audio, timed text, artwork, meta-data) flow into retailers systems automatically and out to customers in a short and predictable amount of time, 99% of the time. Eliminating today’s supply chain complexity will allow all of us to focus on continuing to innovate with production teams to bring amazing new experiences like 3D, 4K video, and many innovations not yet invented to our customer’s homes.
We are nowhere close to this supply chain today but there are no fundamental technology barriers to building it. What I am describing is largely what www.netflix.com has been for consumers since 2007, when Netflix began streaming. If Netflix can build this experience for our customers, then conceivably the industry can collaborate to build the same thing for the supply chain. Given the level of cooperation needed, I predict it will take five to ten years to gain a shared set of motivations, standards, and engineering work to make this happen. Netflix, especially our Digital Supply Chain team, will be heavily involved due to our early scale in digital distribution.
To realize the construction of the Starship Enterprise, we need to innovate on two distinct but complementary tracks. They are:
- Materials quality: Video, audio, text, artwork, and descriptive meta data for all of the needed spoken languages
- B2B order and catalog management: Global online systems to track content orders and to curate content catalogs
Materials Quality
Netflix invested heavily in 2012 in making it easier to deliver high quality video, audio, text, art work, and meta data to Netflix. We expanded our accepted video formats to include the de facto industry standard of Apple Pro Res. We built a new team, Content Partner Operations, to engage content owners and post production houses and mentor their efforts to prepare content for Netflix.
The Content Partner Operations team also began to engage video and audio technology partners to include support for the file formats called out by the Netflix Delivery Specification in the equipment they provide to the industry to prepare and QC digital content. Throughout 2013 you will see the Netflix Delivery Specification supported by a growing list of those equipment manufacturers. Additionally the Content Partner Operations team will establish a certification process for post production houses ability to prepare content for Netflix. Content owners that are new to Netflix delivery will be able to turn any one of many post production houses certified to deliver to Netflix from all of our regions around the world.
Content owners ability to prepare content for Netflix varies considerably. Those content owners who perform the best are those who understand the lineage of all of the files they send to Netflix. Let me illustrate this ‘lineage’ reference with an example.
There is a movie available for Netflix streaming that was so magnificently filmed, it won an Oscar for Cinematography. It was filmed widescreen in a 2.20:1 aspect ratio but it was available for streaming on Netflix in a modified 4:3 aspect ratio. How can this happen? I attribute this poor customer experience to an industry wide epidemic of ‘versionitis’. After this film was produced, it was released in many formats. It was released in theaters, mastered for Blu-ray, formatted for airplane in flight viewing and formatted for the 4x3 televisions that prevailed in the era of this film. The creation of many versions of the film makes perfect sense but versioning becomes versionitis when retailers like Netflix neglect to clearly specify which version they want and when content owners don’t have a good handle on which versions they have. The first delivery made to Netflix of this film must have been derived from the 4x3 broadcast television cut. Netflix QC initially missed this problem and we put this version up for our streaming customers. We eventually realized our error and issued a re-delivery request from the content owner to receive this film in the original aspect ratio that the filmmakers intended for viewing the film. Versionitis from the initial delivery resulted in a poor customer experience and then Netflix and the content owner incurred new and unplanned spending to execute new deliveries to fix the customer experience.
Our recent trip to Europe revealed that the common theme of those studios that struggled with delivery was versionitis. They were not sure which cut of video to deliver or if those cuts of video were aligned with language subtitle files for the content. The studios that performed the best have a well established digital archive that avoids versionitis. They know the lineage of all of their video sources and those video files’ alignment with their correlated subtitle files.
There is a link between content owner revenue and content owner delivery skill. Frequently Netflix finds itself looking for opportunities to grow its streaming catalogs quickly with budget dollars that have not yet been allocated. Increasingly the Netflix deal teams are considering the effectiveness of a content owner’s delivery abilities when making those spending decisions. Simply put, content owners who can deliver quickly and without error are getting more licensing revenue from Netflix than those content owners suffering from versionitis and the resulting delivery problems.
B2B order and catalog management
Today Netflix has a set of tools for managing content orders and curating our content catalogs. These tools are internal to our business and we currently engage the industry for delivery tracking through phone calls and emails containing spreadsheets of content data.
We can do a lot better than to engage the industry with spreadsheets attached to email. We will rectify this in the first half of 2013 with the release of the initial versions of our Content Partner Portal. The universal reaction to reviewing our Nordic launch with content owners was that we were showing them great data (timeliness, error rates, etc) about their deliveries but that they need to see such data much more frequently. The Content Partner Portal will allow all of these metrics to be shared in real time with content owner operations teams while the deliveries are happening. We also foresee that the Content Partner Portal will be used by the Netflix deal team to objectively assess the delivery performance of content owners when planning additional spending.
We also see a role for shared industry standards to help with delivery tracking and catalog curation. The EIDR initiative, for identifying content and versions of content, offers the potential for alignment across companies in the Digital Supply Chain. We are building the ability to label titles with EIDR into our new Content Partner Portal.
Final thoughts
Today’s supply chain is messy and not well suited to help companies in our industry to fully embrace the rapidly growing channel of internet streaming. We are a long way from the Starship Enterprise equivalent of the Digital Supply Chain but the growing global consumer demand for internet streaming clearly provides the incentive to invest together in modernizing the supply chain.
Netflix has many initiatives underway to innovate in developing the supply chain in 2013, some of which were discussed in this post, and we look forward to continuing to collaborate with our content owning partners supply chain innovation efforts.
Netflix is hiring for open positions in our Digital Supply Chain team. Please visit http://jobs.netflix.com to see our open positions. We also put together a short video about the supply chain for a recent job fair. Here is a link to that video.
Kevin McEntee
VP Digital Supply Chain
Building the Netflix UI for Wii U
We recently launched on Nintendo’s new Wii U game console. Like other Netflix UIs, we present TV shows and movies we think you’ll enjoy in a clear and fast user interface. While this UI introduces the first Netflix 1080p browse UI for game consoles, it also expands on ideas pioneered elsewhere like second screen control.
Virtual WebKit Frame
Like many of our other device UIs, our Wii U experience is built for WebKit in HTML5. Since the Wii U has two screens, we created a Virtual WebKit Frame, which partitions the UI into one area that is output to TV and one area that is output to the GamePad.
This gives us the flexibility to vary what is rendered on each screen as the design dictates, while sharing application state and logic in a single JavaScript VM. We also have a safe zone between the TV and GamePad areas so we can animate elements off the edge of the TV without appearing on the GamePad.
We started off with common Netflix TV UI engineering performance practices such as view pooling and accelerated compositing. View pooling reuses DOM elements to minimize DOM churn, and Accelerated Compositing (AC) allows us to designate certain DOM elements to be cached as a bitmap and rendered by the Wii U’s GPU.
In WebKit, each DOM node that produces visual output has a corresponding RenderObject, stored in the Render Tree. In turn, each RenderObject is associated with a RenderLayer. Some RenderLayers get backing surfaces when hardware acceleration is enabled . These layers are called compositing layers and they paint into their backing surfaces instead of the common bitmap that represents the entire page. Subsequently, the backing surfaces are composited onto the destination bitmap. The compositor applies transformations specified by the layer’s CSS -webkit-transform to the layer’s surface before compositing it. When a layer is invalidated, only its own content needs to be repainted and re-composited. If you’re interested to learn more, I suggest reading GPU Accelerated Compositing in Chrome.
Performance
After modifying the UI to take advantage of accelerated compositing, we found that the frame rate on device was still poor during vertical navigation, even though it rendered at 60fps in desktop browsers.
When the user browses up or down in the gallery, we animate 4 rows of poster art on TV and mirror those 4 rows on the GamePad. Preparing, positioning, and animating only 4 rows allows us to reduce (expensive) structural changes to the DOM while being able to display many logical rows and support wrapping. Each row maintains up to 14 posters, requiring us to move and scale a total of 112 images during each up or down navigation. Our UI’s posters are 284 x 405 pixels and eat up 460,080 bytes of texture memory each, regardless of file size. (You need 4 bytes to represent each pixel’s RGBA value when the image is decompressed in memory.)
Layout of poster art in the gallery |
To improve performance, we tried a number of animation strategies, but none yielded sufficient gains. We knew that when we kicked off an animation, there was an expensive style recalculation. But the WebKit Layout & Rendering timeline didn’t help us figure out which DOM elements were responsible.
![]() |
WebKit Layout & Rendering Timeline |
We worked with our platform team to help us profile WebKit, and we were now able to see how DOM elements relate to the Recalculate Style operations.
![]() |
Instrumented Call Stack over Time |
Through experimentation, we discovered that for our UI, there is a material performance gain when setting inline styles instead of modifying classes on elements that participate in vertical navigation.
We also found that some CSS selector patterns cause deep, expensive Recalculate Style operations. It turns out that the mere presence of the following pattern in CSS triggers a deep Recalculate Style:
Moreover, a -webkit-transition with duration greater than 0 causes the Recalculate Style operations to be repeated several times during the lifetime of the animation.
After removing all CSS selectors of this pattern, the resulting Recalculate Style shape is shallower and consumes less time.
Delivering great experiences
Our team builds innovative UIs, experiments with new concepts using A/B testing, and continually delivers new features. We also have to make sure our UIs perform fast on a wide range of hardware, from inexpensive consumer electronics devices all the way up to more powerful devices like the Wii U and PS3.
If this kind of innovation excites you as much as it does me, join our team!
A Closer Look At The Christmas Eve Outage
Netflix streaming was impacted on Christmas Eve 2012 by problems in the Amazon Web Services (AWS) Elastic Load Balancer (ELB) service that routes network traffic to the Netflix services supporting streaming. The postmortemreport by AWS can be read here.
We apologize for the inconvenience and loss of service. We’d like to explain what happened and how we continue to invest in higher availability solutions.
Partial Outage
The problems at AWS caused a partial Netflix streaming outage that started at around 12:30 PM Pacific Time on December 24 and grew in scope later that afternoon. The outage primarily affected playback on TV connected devices in the US, Canada and Latin America. Our service in the UK, Ireland and Nordic countries was not impacted.
Netflix uses hundreds of ELBs. Each one supports a distinct service or a different version of a service and provides a network address that your Web browser or streaming device calls. Netflix streaming has been implemented on over a thousand different streaming devices over the last few years, and groups of similar devices tend to depend on specific ELBs. Requests from devices are passed by the ELB to the individual servers that run the many parts of the Netflix application. Out of hundreds of ELBs in use by Netflix, a handful failed, losing their ability to pass requests to the servers behind them. None of the other AWS services failed, so our applications continued to respond normally whenever the requests were able to get through.
The Netflix Web site remained up throughout the incident, supporting sign up of new customers and streaming to Macs and PCs, although at times with higher latency and a likelihood of needing to retry. Over-all streaming playback via Macs and PCs was only slightly reduced from normal levels. A few devices also saw no impact at all as those devices have an ELB configuration that kept running throughout the incident, providing normal playback levels.
At 12:24 PM Pacific Time on December 24 network traffic stopped on a few ELBs used by a limited number of streaming devices. At around 3:30 PM on December 24, network traffic stopped on additional ELBs used by game consoles, mobile and various other devices to start up and load lists of TV shows and movies. These ELBs were patched back into service by AWS at around 10:30 PM on Christmas Eve, so game consoles etc. were impacted for about seven hours. Most customers were fully able to use the service again at this point. Some additional ELB cleanup work continued until around 8 am on December 25th, when AWS finished restoring service to all the ELBs in use by Netflix, and all devices were streaming again.
Even though Netflix streaming for many devices was impacted, this wasn't an immediate blackout. Those devices that were already running Netflix when the ELB problems started were in many cases able to continue playing additional content.
Christmas Eve is traditionally a slow Netflix night as many members celebrate with families or spend Christmas Eve in other ways than watching TV shows or movies. We see significantly higher usage on Christmas Day and increased streaming rates continue until customers go back to work or school. While we truly regret the inconvenience this outage caused our customers on Christmas Eve, we were also fortunate to have Netflix streaming fully restored before a much higher number of our customers would have been affected.
What Broke And What Should We Do About It
In its postmortem on the outage, AWS reports that “...data was deleted by a maintenance process that was inadvertently run against the production ELB state data”. This caused data to be lost in the ELB service back end, which in turn caused the outage of a number of ELBs in the US-East region across all availability zones starting at 12:24 PM on December 24.
The problem spread gradually, causing broader impact until “At 5:02 PM PST, the team disabled several of the ELB control plane workflows”.
The AWS team had to restore the missing state data from backups, which took all night. “By 5:40 AM PST ... the new ELB state data had been verified.”. AWS has put safeguards in place against this particular failure, and also says “We are confident that we could recover ELB state data in a similar event significantly faster”.
Netflix is designed to handle failure of all or part of a single availability zone in a region as we run across three zones and operate with no loss of functionality on two. We are working on ways of extending our resiliency to handle partial or complete regional outages.
Previous AWS outages have mostly been at the availability zone level, and we’re proud of our track record in terms of up time, including our ability to keep Netflix streaming running while other AWS hosted services are down.
Our strategy so far has been to isolate regions, so that outages in the US or Europe do not impact each other.
It is still early days for cloud innovation and there is certainly more to do in terms of building resiliency in the cloud. In 2012 we started to investigate running Netflix in more than one AWS region and got a better gauge on the complexity and investment needed to make these changes.
We have plans to work on this in 2013. It is an interesting and hard problem to solve, since there is a lot more data that will need to be replicated over a wide area and the systems involved in switching traffic between regions must be extremely reliable and capable of avoiding cascading overload failures. Naive approaches could have the downside of being more expensive, more complex and cause new problems that might make the service less reliable. Look for upcoming blog posts as we make progress in implementing regional resiliency.
As always, we arehiring the best engineers we can find to work on these problems, and areopen sourcing the solutions we develop as part of our platform.
Happy New Year and best wishes for 2013.
Janitor Monkey - Keeping the Cloud Tidy and Clean
One of the great advantages of moving from a private datacenter into the cloud is that you have quick and easy access to nearly limitless new resources. Innovation and experimentation friction is greatly reduced: to push out a new application release you can quickly build up a new cluster, to get more storage just attach a new volume, to backup your data just make a snapshot, to test out a new idea just create new instances and get to work. The downside of this flexbility is that it is pretty easy to lose track of the cloud resources that are no longer needed or used. Perhaps you forgot to delete the cluster with the previous version of your application, or forgot to destroy the volume when you no longer needed the extra disk. Taking snapshots is great for backups, but do you really need them from 12 months ago? It's not just forgetfulness that can cause problems. API and network errors can cause your request to delete an unused volume to get lost.
At Netflix, when we analyzed our Amazon Web Services (AWS) usage, we found a lot of unused resources and we needed a solution to rectify this problem. Diligent engineers can manualy delete unused resources via Asgard but we needed a way to automatically detect and clean them up. Our solution was Janitor Monkey.
We have written about our Simian Army in the past and we are now proud to announce that the source code for the new member of our simian army, Janitor Monkey, is now open and available to the public.
What is Janitor Monkey?
Janitor Monkey is a service which runs in the Amazon Web Services (AWS) cloud looking for unused resources to clean up. Similar to Chaos Monkey, the design of Janitor Monkey is flexible enough to allow extending it to work with other cloud providers and cloud resources. The service is configured to run, by default, on non-holiday weekdays at 11 AM. The schedule can be easily re-configured to fit your business' need.Janitor Monkey determines whether a resource should be a cleanup candidate by applying a set of rules on it. If any of the rules determines that the resource is a cleanup candidate, Janitor Monkey marks the resource and schedules a time to clean it up. We provide a collection of rules in the open sourced version that are currently used at Netflix and believed general enough to be used by most users. The design of Janitor Monkey also makes it simple to customize rules or to add new ones.
Since there can be exceptions when you want to keep an unused resource around, before a resource is deleted by Janitor Monkey, the owner of the resource will receive a notification a configurable number of days ahead of the cleanup time. This is to prevent a resource that is still needed from being deleted by Janitor Monkey. The resource owner can then flag the resources that they want to keep as exceptions and Janitor Monkey will leave them alone.
Over the last year Janitor Monkey has deleted over 5,000 resources running in our production and test environments. It has helped keep our costs down and has freed up engineering time which is no longer needed to manage unused resources.
Resource Types and Rules
Four types of AWS resources are currently managed by Janitor Monkey: Instances, EBS Volumes, EBS Volume Snapshots, and Auto Scaling Groups. Each of these resource types has its own rules to mark unused resources. For example, an EBS volume is marked as a cleanup candidate if it has not been attached to any instance for 30 days. Another example is that an instance will be cleaned by Janitor Monkey if it is not in any auto scaling group for over 3 days since we know these are experimentation instances -- all others must be in auto scaling groups. The number of retention days in these rules is configurable so the rules can be easily customized to fit your business requirements. We plan to make Janitor Monkey support more resource types in the future, such as launch configurations, security groups, and AMIs. The design of Janitor Monkey makes adding new resource types easy.How Janitor Monkey Cleans
Janitor Monkey works in three stages: "mark, notify, delete". When Janitor Monkey marks a resource as a cleanup candidate, it schedules a time to delete the resource. The delete time is specified in the rule that marks the resource. Every resource is associated with an owner email, which can be specified as a tag on the resource. You can also easily extend Janitor Monkey to obtain this information from your internal system. The simplest way is using a default email address, e.g. your team's email list for all the resources. You can configure a number of days for specifying when to let Janitor Monkey send notification to the resource owner before the scheduled termination. By default the number is 2, which means that the owner will receive a notification 2 business days ahead of the termination date. During the 2-day period the resource owner can decide if the resource can be deleted. In case a resource needs to be retained, the owner can use a simple REST interface to flag the resource to be excluded by Janitor Monkey. The owner can later use another REST interface to remove the flag and Janitor Monkey will then be able to manage the resource again. When Janitor Monkey sees a resource marked as a cleanup candidate and the scheduled termination time has passed, it will delete the resource. The resource owner can also delete the resource manually if he/she wants to release the resource earlier to save cost. When the status of the resource changes, making the resource not a cleanup candidate (e.g. a detached EBS volume is attached to an instance), Janitor Monkey will unmark the resource and no cleanup will occur.Configuration and Customization
The resource types managed by Janitor Monkey, the rules for each resource type to mark cleanup candidates, and the parameters used to configure each individual rule, are all configurable. You can easily customize Janitor Monkey with the most appropriate set of rules for your resources by setting Janitor Monkey properties in a configuration file. You can also create your own rules or add support for new resource types, and we encourage you to contribute your cleanup rules to the project so that all can benefit.Auditing, Logging, and Costs
Janitor Monkey events are logged in an Amazon SimpleDB table by default. You can easily check the SimpleDB records to find out what Janitor Monkey has done. The resources managed by Janitor Monkey are also stored in SimpleDB. At Netflix we have a UI for managing the Janitor Monkey resources and we have plans to open source it in the future as well.There could be associated costs with Amazon SimpleDB, but in most cases the activity of Janitor Monkey should be small enough to fall within Amazon's Free Usage Tier. Ultimately the costs associated with running Janitor Monkey are your responsibility. For your reference, the costs of Amazon SimpleDB can be found at http://aws.amazon.com/simpledb/pricing/
Coming Up
In the near future we are planning to release some new resource types for Janitor Monkey to manage. As mentioned earlier, the next candidate will likely be launch configuration. Also, we will add support for using Edda to implement existing and new Janitor Monkey rules. Edda allows us to query the history of resources, helping Janitor Monkey find unused resources more accurately and reliably.Summary
Janitor Monkey helps keep our cloud clean and clutter-free. We hope you find Janitor Monkey to be useful for your business. We'd appreciate any feedback on it. We're always looking for new members to join the team. If you are interested in working on great open source software, take a look at jobs.netflix.com for current openings!Janitor Monkey Links
Netflix Cloud Platform
Amazon Web Services
Hadoop Platform as a Service in the Cloud
by Sriram Krishnan and Eva Tse, Data Science & Engineering
Hadoop has become the de facto standard for managing and processing hundreds of terabytes to petabytes of data. At Netflix, our Hadoop-based data warehouse is petabyte-scale, and growing rapidly. However, with the big data explosion in recent times, even this is not very novel anymore. Our architecture, however, is unique as it enables us to build a data warehouse of practically infinite scale in the cloud (both in terms of data and computational power).
In this article, we discuss our cloud-based data warehouse, how it is different from a traditional data center-based Hadoop infrastructure, and how we leverage the elasticity of the cloud to build a system that is dynamically scalable. We also introduce Genie, which is our in-house Hadoop Platform as a Service (PaaS) that provides REST-ful APIs for job execution and resource management.
Architectural Overview
In a traditional data center-based Hadoop data warehouse, the data is hosted on the Hadoop Distributed File System (HDFS). HDFS can be run on commodity hardware, and provides fault-tolerance and high throughput access to large datasets. The most typical way to build a Hadoop data warehouse in the cloud would be to follow this model, and store your data on HDFS on your cloud-based Hadoop clusters. However, as we describe in the next section, we have chosen to store all of our data on Amazon’s Storage Service (S3), which is the core principle on which our architecture is based. A high-level overview of our architecture is shown below, followed by the details.
S3 as the Cloud Data Warehouse
We use S3 as the “source of truth” for our cloud-based data warehouse. Any dataset that is worth retaining is stored on S3. This includes data from billions of streaming events from (Netflix-enabled) televisions, laptops, and mobile devices every hour captured by our log data pipeline (called Ursula), plus dimension data from Cassandra supplied by our Aegisthus pipeline.
So why do we use S3, and not HDFS as the source of truth? Firstly, S3 is designed for 99.999999999% durability and 99.99% availability of objects over a given year, and can sustain concurrent loss of data in two facilities. Secondly, S3 provides bucket versioning, which we use to protect against inadvertent data loss (e.g. if a developer errantly deletes some data, we can easily recover it). Thirdly, S3 is elastic, and provides practically “unlimited” size. We grew our data warehouse organically from a few hundred terabytes to petabytes without having to provision any storage resources in advance. Finally, our use of S3 as the data warehouse enables us to run multiple, highly dynamic clusters that are adaptable to failures and load, as we will show in the following sections.
On the flip side, reading and writing from S3 can be slower than writing to HDFS. However, most queries and processes tend to be multi-stage MapReduce jobs, where mappers in the first stage read input data in parallel from S3, and reducers in the last stage write output data back to S3. HDFS and local storage are used for all intermediate and transient data, which reduces the performance overhead.
Multiple Hadoop Clusters for Different Workloads
We currently use Amazon’s Elastic MapReduce (EMR) distribution of Hadoop. Our use of S3 as the data warehouse enables us to spin up multiple Hadoop clusters for different workloads, all accessing the exact same data. A large (500+ node) "query" cluster is used by engineers, data scientists and analysts to perform ad hoc queries. Our "production" (or “SLA”) cluster, which is around the same size as the query cluster, runs SLA-driven ETL (extract, transform, load) jobs. We also have several other “dev” clusters that are spun up as needed. If we had used HDFS as our source of truth, then we would need a process to replicate data across all the clusters. With our use of S3, this is non-issue because all clusters have instant access to the entire dataset.
We dynamically resize both our query and production clusters daily. Our query cluster can be smaller at night when there are fewer developers logged in, whereas the production cluster must be larger at night, when most of our ETL is run. We do not have to worry about data redistribution or loss during expand/shrink because the data is on S3. And finally, although our production and query clusters are long-running clusters in the cloud, we can treat them as completely transient. If a cluster goes down, we can simply spin up another identically sized cluster (potentially in another Availability Zone, if needed) in tens of minutes with no concerns about data loss.
Tools and Gateways
Our developers use a variety of tools in the Hadoop ecosystem. In particular, they use Hive for ad hoc queries and analytics, and use Pig for ETL and algorithms. Vanilla java-based MapReduce is also occasionally used for some complex algorithms. Python is the common language of choice for scripting various ETL processes and Pig User Defined Functions (UDF).
Our Hadoop clusters are accessible via a number of “gateways”, which are just cloud instances that our developers log into and run jobs using the command-line interfaces (CLIs) of Hadoop, Hive and Pig. Often our gateways become single points of contention, when there are many developers logged in and running a large number of jobs. In this case, we encourage the heavy users to spin up new pre-baked instances of our “personal” gateway AMIs (Amazon Machine Images) in the cloud. Using a personal gateway also allows developers to install other client-side packages (such as R) as needed.
Introducing Genie - the Hadoop Platform as a Service
Amazon provides Hadoop Infrastructure as a Service, via their Elastic MapReduce (EMR) offering. EMR provides an API to provision and run Hadoop clusters (i.e. infrastructure), on which you can run one or more Hadoop jobs. We have implemented Hadoop Platform as a Service (called “Genie”), which provides a higher level of abstraction, where one can submit individual Hadoop, Hive and Pig jobs via a REST-ful API without having to provision new Hadoop clusters, or installing any Hadoop, Hive or Pig clients. Furthermore, it enables administrators to manage and abstract out configurations of various back-end Hadoop resources in the cloud.
Why did we build Genie?
Our ETL processes are loosely-coupled, using a combination of Hadoop and non-Hadoop tools, spanning the cloud and our data center. For instance, we run daily summaries using Pig and Hive on our cloud-based Hadoop data warehouse, and load the results into our (order of magnitude smaller) relational data warehouse in the data center. This is a fairly common big data architecture, where a much smaller relational data warehouse is used to augment a Hadoop-based system. The former provides more real-time interactive querying and reporting, plus better integration with traditional BI (business intelligence) tools. Currently, we are using Teradata as our relational data warehouse. However, we are also investigating Amazon’s new Redshift offering.
We use an enterprise scheduler (UC4) in our data center to define dependencies between various jobs between our data center and the cloud, and run them as “process flows”. Hence, we need a mechanism to kick off Hadoop, Hive and Pig jobs from any client, without having to install the entire Hadoop software stack on them. Furthermore, since we now run hundreds of Hadoop jobs per hour, we need this system to be horizontally scalable, especially since our workload will increase as we migrate more of our ETL and processing to Hadoop in the cloud. Finally, since our clusters in the cloud are potentially transient, and there is more than one cluster that can run Hadoop jobs, we need to abstract away physical details of the backend clusters from our clients.
Why build something new?
Why did we build Genie, as opposed to using something else that is already available? The simple answer is that there was nothing that was already out there in the open source community that handled our requirements - an API to run jobs, abstraction of backend clusters, an ability to submit jobs to multiple clusters, and scalable enough (horizontally or otherwise) to support our usage. The closest alternative that we considered was Oozie, which is a workflow scheduler similar to UC4. It is not a job submission API like Genie (hence not an apples-to-apples comparison). We ruled out the use of Oozie as our scheduler, since it only supports jobs in the Hadoop ecosystem, whereas our process flows span Hadoop and non-Hadoop jobs. Also, when we started our work on Genie, Oozie didn’t support Hive, which was a key requirement for us. A closer alternative to Genie is Templeton, which is now part of HCatalog. However, Templeton doesn’t support concurrent job submissions to more than one cluster, is still evolving, and doesn’t appear quite ready for production.
What is Genie?
Genie is a set of REST-ful services for job and resource management in the Hadoop ecosystem. Two key services are the Execution Service, which provides a REST-ful API to submit and manage Hadoop, Hive and Pig jobs, and the Configuration Service, which is a repository of available Hadoop resources, along with the metadata required to connect to and run jobs on these resources.
Execution Service
Clients interact with Genie via the Execution Service API. They launch a job by sending a JSON or XML message to this API to specify a set of parameters, which include:
- a job type, which can be Hadoop, Hive or Pig,
- command-line arguments for the job,
- file dependencies such as scripts and jar files (e.g. for UDFs) on S3,
- a schedule type, such as “ad hoc” or “SLA”, which Genie uses to map the job to an appropriate cluster, and
- a name for the Hive metastore to connect to (e.g. prod, test, or one of the dev ones).
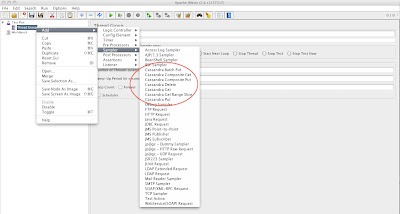
If a job submission is successful, Genie returns a job id for the job, which can be used to get the job status, and the output URL. The output URL is an HTTP URL pointing to the working directory of the job, which contains the standard output and error logs (see screenshot below). Each job id can translate to multiple MapReduce jobs depending on the number of intermediate stages in the Hive or Pig query being run.
Configuration Service
The Configuration Service is used to keep track of all the clusters that are currently running, and the schedule types that they support. For instance, our query cluster has been configured to support “ad hoc” jobs, whereas our production cluster has been configured to support “SLA” jobs. When a cluster comes up, we publish to the Configuration Service the type of jobs that it supports, and also the set of configuration files for that cluster (viz. the mapred-site.xml, core-site.xml, hdfs-site.xml for Hadoop, and hive-site.xml for Hive). We also mark its status as “Up”. Similarly, when a cluster goes down we mark it as “Terminated”. There is also an “Out of Service” state for clusters, which means it is alive, but not supporting any new job submissions. This is useful during upgrades and the termination process, when a cluster should no longer accept any new jobs, but should let all running jobs finish before it is terminated. This service is complementary to Eureka, which is designed to be a repository of metadata for ephemeral instances (and not clusters) in the cloud.
When the Execution Service receives a job submission request, it maps the job to an appropriate cluster using the Configuration Service. If there are multiple clusters that could satisfy the job requirements, it currently picks one of the candidate clusters at random. However, this behavior could be modified by implementing a custom load balancer (e.g. based on available slots). It then fetches all the configuration files for that cluster, and forks off the individual Hadoop, Hive or Pig jobs into separate individual working directories for each job (see screenshot above), thereby providing isolation between Genie and the jobs themselves. A single Genie instance can thus support multiple concurrent job submissions to different clusters, all completely abstracted out from the clients.
How do we use Genie for dynamic resource management?
Various engineering teams in Netflix run their services on reserved instances on ASGs (auto-scaling groups) on AWS, which they expand and shrink based on load. Most of the ETL jobs run after midnight (PST), which conveniently happens to be the time when most of these ASGs have scaled down (due to the natural viewing pattern of Netflix in North America). Hence, we use these surplus reserved instances to spin up additional “bonus” clusters supplementing our other production clusters. We register them with the Configuration Service, and the Genie clients (i.e. ETL jobs) access these new clusters using the Execution Service API. When the engineering teams need their instances back, the bonus clusters are terminated and de-registered, and are no longer available via Genie clients.
There is no need to perform any rolling upgrades, which is common in traditional Hadoop clusters. If we need to perform an upgrade of our production (SLA) cluster, one option is to spin up a new production cluster with the upgraded software stack, and stop routing traffic to the old cluster by simply setting its status to “Out of Service” (we call this a “red-black” push). Alternatively, we can perform an upgrade on a running cluster by setting its status to “Out of Service”, and temporarily marking another running cluster as an SLA cluster, while the upgrade is being performed. If we do not want running jobs to fail, we wait for them to finish before terminating the old cluster or upgrading a running cluster. This is similar to the capability provided by Asgard for application deployments and cloud instance management.
What is the current deployment status of Genie?
Although it continues to be a work in progress, we use Genie heavily in our production environment. It is currently deployed in a 6-12 node Auto Scaling Group (ASG), spanning three Availability Zones for load-balancing and fault tolerance purposes. For horizontal scalability, we adjust the number of nodes based on load (i.e. the number of concurrent running jobs). This is configured via CloudWatch alarms, coupled with auto-scaling policies managed by Asgard. Genie instances are registered with Eureka, and clients use the Eureka API to choose an available instance to run their job. To avoid client skew, Genie also forwards job requests to other lightly loaded instances, when an instance gets more requests than it can handle. Genie currently supports hundreds of concurrent job submissions at any time. On a daily basis, it runs hundreds of Hive jobs from our visualization tools and our custom Hive/Pig Web UI, plus thousands of Hive and Pig-based ETL jobs. Scaling to thousands of concurrent jobs is theoretically possible, simply by increasing the number of instances in the ASG.
Summary
In this article, we described the cloud-based Hadoop architecture at Netflix, which is significantly different than data-center based ones. We are able to leverage the elasticity of the cloud to scale up and down, and we can spin up multiple clusters dynamically to address different kinds of workloads. We also described Genie, which is a horizontally scalable Hadoop Platform as a Service. Genie exposes APIs to submit and manage jobs, as well as manage and abstract out backend Hadoop resources. We are considering open sourcing Genie in the near future, and would love to hear your feedback on whether this might be useful in your big data environment.
If building critical big data components like this sounds exciting to you (for a service that millions of people love worldwide!), take a look at http://jobs.netflix.com.