- Responding to user input quickly while deferring expensive user interface updates
- Managing main and video memory footprint of a single page application
- Understanding WebKit's interpretation and response to changes in HTML and CSS
- Achieving highest possible animation frame rates using accelerated compositing
WebKit in Your Living Room
Ephemeral Volatile Caching in the cloud
In most applications there is some amount of data that will be frequently used. Some of this data is transient and can be recalculated, while other data will need to be fetched from the database or a middle tier service. In the Netflix cloud architecture we use caching extensively to offset some of these operations. This document details Netflix’s implementation of a highly scalable memcache-based caching solution, internally referred to as EVCache.
Why do we need Caching?
Some of the objectives of the Cloud initiative were- Faster response time compared to Netflix data center based solution
- Session based App in data center to Stateless without sessions in the cloud
- Use NoSQL based persistence like Cassandra/SimpleDB/S3
To solve these we needed the ability to store data in a cache that was Fast, Shared and Scalable. We use cache to front the data that is computed or retrieved from a persistence store like Cassandra, or other Amazon AWS’ services like S3 and SimpleDB and they can take several hundred milliseconds at the 99th percentile, thus causing a widely variable user experience. By fronting this data with a cache, the access times would be much faster & linear and the load on these datastores would be greatly reduced. Caching also enables us to respond to sudden request spikes more effectively. Additionally, an overloaded service can often return a prior cached response; this ensures that user gets a personalized response instead of a generic response. By using caching effectively we have reduced the total cost of operation.
What is EVCache?
EVCache is a memcached & spymemcached based caching solution that is well integrated with Netflix and AWS EC2 infrastructure.EVCache is an abbreviation for:
Ephemeral - The data stored is for a short duration as specified by its TTL1 (Time To Live).
Volatile - The data can disappear any time (Evicted2).
Cache – An in-memory key-value store.
How is it used?
Features
We will now detail the features including both add-ons by Netflix and those that come with memcache.- Overview
- Distributed Key-Value store, i.e., the cache is spread across multiple instances
- AWS Zone-Aware and data can be replicated across zones.
- Registers and works with Netflix’s internal Naming Service for automatic discovery of new nodes/services.
- To store the data, Key has to be a non-null String and value can be a non-null byte-array, primitives, or serializable object. Value should be less than 1 MB.
- As a generic cache cluster that can be used across various applications, it supports an optional Cache Name, to be used as namespace to avoid key collisions.
- Typical cache hit rates are above 99%.
- Works well with Netflix Persister Framework7. For E.g., In-memory ->backed by EVCache -> backed by Cassandra/SimpleDB/S3
- Elasticity and deployment ease: EVCache is linearly scalable. We monitor capacity and can add capacity within a minute and potentially re-balance and warm data in the new node within a few minutes. Note that we have pretty good capacity modeling in place and so capacity change is not something we do very frequently but we have good ways of adding capacity while actively managing the cache hit rate. Stay tuned for more on this scalable cache warmer in an upcoming blog post.
- Latency: Typical response time in low milliseconds. Reads from EVCache are typically served back from within the same AWS zone. A nice side effect of zone affinity is that we don’t have any data transfer fees for reads.
- Inconsistency: This is a Best Effort Cache and the data can get inconsistent. The architecture we have chosen is speed instead of consistency and the applications that depend on EVCache are capable of handling any inconsistency. For data that is stored for a short duration, TTL ensures that the inconsistent data expires and for the data that is stored for a longer duration we have built consistency checkers that repairs it.
- Availability: Typically, the cluster never goes down as they are spread across multiple Amazon Availability Zones. When instances do go down occasionally, cache misses are minimal as we use consistent hashing to shard the data across the cluster.
- Total Cost of Operations: Beyond the very low cost of operating the EVCache cluster, one has to be aware that cache misses are generally much costlier - the cost of accessing services AWS SimpleDB, AWS S3, and (to a lesser degree) Cassandra on EC2, must be factored in as well. We are happy with the overall cost of operations of EVCache clusters which are highly stable, linearly scalable.
Under the Hood
Server: The Server consist of the following:- memcached server.
- Java Sidecar - A Java app that communicates with the Discovery Service6( Name Server) and hosts admin pages.
- Various apps that monitor the health of the services and report stats.
Client: A Java client discovers EVCache servers and manages all the CRUD3 (Create, Read, Update & Delete) operations. The client automatically handles the case when servers are added to or removed from the cluster. The client replicates data (AWS Zone5 based) during Create, Update & Delete Operations; on the other hand, for Read operations the client gets the data from the server which is in the same zone as the client.
We will be open sourcing this Java client sometime later this year so we can share more of our learnings with the developer community.
Single Zone Deployment
The figure below image illustrates the scenario in AWS US-EAST Region4 and Zone-A where an EVCache cluster with 3 instances has a Web Application performing CRUD operations (on the EVcache system).- Upon startup, an EVCache Server instance registers with the Naming Service6 (Netflix’s internal name service that contains all the hosts that we run).
- During startup of the Web App, the EVCache Client library is initialized which looks up for all the EVCache server instances registered with the Naming Services and establishes a connection with them.
- When the Web App needs to perform CRUD operation for a key the EVCache client selects the instance on which these operations can be performed. We use Consistent Hashing to shard the data across the cluster.

Multi-Zone Deployment
The figure below illustrates the scenario where we have replication across multiple zones in AWS US-EAST Region. It has an EVCache cluster with 3 instances and a Web App in Zone-A and Zone-B.- Upon startup, an EVCache Server instance in Zone-A registers with the Naming Service in Zone-A and Zone-B.
- During the startup of the Web App in Zone-A , The Web App initializes the EVCache Client library which looks up for all the EVCache server instances registered with the Naming Service and connects to them across all Zones.
- When the Web App in Zone-A needs to Read the data for a key, the EVCache client looks up the EVCache Server instance in Zone –A which stores this data and fetches the data from this instance.
- When the Web App in Zone-A needs to Write or Delete the data for a key, the EVCache client looks up the EVCache Server instances in Zone–A and Zone-B and writes or deletes it.
Case Study : Movie and TV show similarity
One of the applications that uses caching heavily is the Similars application. This application suggests Movies and TV Shows that have similarities to each other. Once the similarities are calculated they are persisted in SimpleDB/S3 and are fronted using EVCache. When any service, application or algorithm needs this data it is retrieved from the EVCache and result is returned.- A Client sends a request to the WebApp requesting a page and the algorithm that is processing this requests needs similars for a Movie to compute this data.
- The WebApp that needs a list of similars for a Movie or TV show looks up EVCache for this data. Typical cache hit rate is above 99.9%.
- If there is a cache miss then the WebApp calls the Similars App to compute this data.
- If the data was previously computed but missing in the cache then Similars App will read it from SimpleDB. If it were missing in SimpleDB then the app Calculates the similars for the given Movie or TV show.
- This computed data for the Movie or TV Show is then written to EVCache.
- The Similars App then computes the response needed by the client and returns it to the client.
Metrics, Monitoring, and Administration
Administration of the various clusters is centralized and all the admin & monitoring of the cluster and instances can be performed via web illustrated below.The server view below shows the details of each instance in the cluster and also rolls up by the stats for the zone. Using this tool the contents of a memcached slab can be viewed
The EVCache Clusters currently serve over 200K Requests/sec at peak loads. The below chart shows number of requests to EVCache every hour.
The average latency is around 1 millisecond to 5 millisecond. The 99th percentile is around 20 millisecond.
Typical cache hit rates are above 99%.
Join Us
Like what you see and want to work on bleeding edge performance and scale?We’re hiring !
References
- TTL : Time To Live for data stored in the cache. After this time the data will expire and when requested will not be returned.
- Evicted : Data associated with a key can be evicted(removed) from the cache even though its TTL has not yet exceed. This happens when the cache is running low on memory and it needs to make some space to add the new data that we are storing. The eviction is based on LRU (Least Recently Used).
- CRUD : Create, Read, Update and Delete are the basic functions of storage.
- AWS Region : It is a Geographical region and currently in US East (virginia), US West, EU (Ireland), Asia Pacific (Singapore), Asia Pacific (Tokyo) and South America (Sao Palo).
- AWS Zone: Each availability zone runs on its own physically distinct and independent infrastructure. You can also think this as a data center.
- Naming Service : It is a service developed by Netflix and is a registery for all the instances that run Netflix Services.
- Netflix Persister Framework : A Framework developed by Netflix that helps user to persist data across various datastore like In-Memory/EVCache/Cassandra/SimpleDB/S3 by providing a simple API.
by Shashi Madappa, Senior Software Engineer, Personalization Infrastructure Team
Announcing Astyanax
What is Astyanax?
connection pool | The connection pool abstraction and several implementations including round robin, token aware and bag of connections. |
cassandra-thrift API implementation | Cassandra Keyspace and Cluster level APIs implementing the thrift interface. |
recipes and utilities | Utility classes built on top of the astyanax-cassandra-thrift API. |
Astyanax API
- Key and column types are defined in a ColumnFamily class which eliminates the need to specify serializers.
- Multiple column family key types in the same keyspace.
- Annotation based composite column names.
- Automatic pagination.
- Parallelized queries that are token aware.
- Configurable consistency level per operation.
- Configurable retry policy per operation.
- Pin operations to specific node.
- Async operations with a single timeout using Futures.
- Simple annotation based object mapping.
- Operation result returns host, latency, attempt count.
- Tracer interfaces to log custom events for operation failure and success.
- Optimized batch mutation.
- Completely hide the clock for the caller, but provide hooks to customize it.
- Simple CQL support.
- RangeBuilders to simplify constructing simple as well as composite column ranges.
- Composite builders to simplify creating composite column names.
Recipes
- CSV importer.
- JSON exporter to convert any query result to JSON with a wide range of customizations.
- Parallel reverse index search.
- Key unique constraint validation.
Connection pool
HostSupplier/NodeAutoDiscovery | Background task that frequently refreshes the client host list. There is also an implementation that consolidates a describe ring against the local region's list of hosts to prevent cross-regional client traffic. |
TokenAware | The token aware connection pool implementation keeps track of which hosts own which tokens and intelligently directs traffic to a specific range with fallback to round robin. |
RoundRobin | This is a standard round robin implementation |
Bag | We found that for our shared cluster we needed to limit the number of client connections. This connection pool opens a limited number of connections to random hosts in a ring. |
ExecuteWithFailover | This abstraction lets the connection pool implementation capture a fail-over context efficiently |
RetryPolicy | Retry on top of the normal fail-over in ExecuteWithFailover. Fail-over addresses problems such as connections not available on a host, a host going down in the middle of an operation or timeouts. Retry implements backoff and retrying the entire operation with an entirely new context. |
BadHostDetector | Determine when a node has gone down, based on timeouts |
LatencyScoreStrategy | Algorithm to determine a node's score based on latency. Two modes, unordered (round robin) ordered (best score gets priority) |
ConnectionPoolMonitor | Monitors all events in the connection pool and can tie into proprietary monitoring mechanisms. We found that logging deep in the connection pool code tended to be very verbose so we funnel all events to a monitoring interface so that logging and alerting may be controlled externally. |
Pluggable real-time configuration | The connection pool configuration is kept by a single object referenced throughout the code. For our internal implementation this configuration object is tied to volatile properties that may change at run time and are picked up by the connection pool immediately thereby allowing us to tweak client performance at runtime without having to restart. |
RateLimiter | Limits the number of connections that can be opened within a given time window. We found this necessary for certain types of network outages that cause thundering herd of connection attempts overwhelming Cassandra. |
A taste of Astyanax
Accessing Astyanax
- The Astyanax binaries are posted to Maven Central which makes accessing them very easy
- The source code for Astyanax is hosted at Github: https://github.com/Netflix/astyanax
- Extensive documentation is currently at https://github.com/Netflix/astyanax/wiki/Getting-Started
Announcing Servo
In a previous blog post about auto scaling, I mentioned that we would be open sourcing the library that we use to expose application metrics. Servo is that library. It is designed to make it easy for developers to export metrics from their application code, register them with JMX, and publish them to external monitoring systems such as Amazon's CloudWatch. This is especially important at Netflix because we are a data driven company and it is essential that we know what is going on inside our applications in near real time. As we increased our use of auto scaling based on application load, it became important for us to be able to publish custom metrics to CloudWatch so that we could configure auto-scaling policies based on the metrics that most accurately capture the load for a given application. We already had the servo framework in place to publish data to our internal monitoring system, so it was extended to allow for exporting a subset (AWS charges on a per metric basis) of the data into CloudWatch.
Features
- Simple: It is trivial to expose and publish metrics without having to write lots of code such as MBean interfaces.
- JMX Registration: JMX is the standard monitoring interface for Java and can be queried by many existing tools. Servo makes it easy to expose metrics to JMX so they can be viewed from a wide variety of Java tools such as VisualVM.
- Flexible publishing: Once metrics are exposed, it should be easy to regularly poll the metrics and make them available for internal reporting systems, logs, and services like Amazon's CloudWatch. There is also support for filtering to reduce cost for systems that charge per metric, and asynchronous publishing to help isolate the collection from downstream systems that can have unpredictable latency.
The rest of this post provides a quick preview of Servo, for a more detailed overview see the Servo wiki.
Registering Metrics
Registering metrics is designed to be both easy and flexible. Using annotations you can call out the fields or methods that should be monitored for a class and specify both static and dynamic metadata. The example below shows a basic server class with some stats about the number of connections and amount of data that as been seen.
See the annotations wiki page for a more detailed summary of the available annotations and the options that are available. Once you have annotated your class, you will need to register each new object instance with the registry in order for the metrics to get exposed. A default registry is provided that exports metrics to JMX.
Now that the instance is registered metrics should be visible in tools like VisualVM when you run your application.
Publishing Metrics
After getting into JMX, the next step is to collect the data and make it available to other systems. The servo library provides three main interfaces for collecting and publishing data:
- MetricObserver: an observer is a class that accepts updates to the metric values. Implementations are provided for keeping samples in memory, exporting to files, and exporting to CloudWatch.
- MetricPoller: a poller provides a way to collect metrics from a given source. Implementations are provided for querying metrics associated with a monitor registry and arbitrary metrics exposed to JMX.
- MetricFilter: filters are used to restrict the set of metrics that are polled. The filter is passed in to the poll method call so that metrics that can be expensive to collect, will be ignored as soon as possible. Implementations are provided for filtering based on a regular expression and prefixes such as package names.
The example below shows how to configure the collection of metrics each minute to store them on the local file system.
By simply using a different observer, we can instead export the metrics to a monitoring system like CloudWatch.
You have to provide your AWS credentials and namespace at initialization. Servo also provides some helpers for tagging the metrics with common dimensions such as the auto scaling group and instance id. CloudWatch data can be retrieved using the standard Amazon tools and APIs.
Related Links
Servo ProjectServo Documentation
Netflix Open Source
Announcing Priam
- Backup and recovery
- Bootstrapping and automated token assignment.
- Centralized configuration management
- RESTful monitoring and metrics
Address DC Rack Status State Load Owns Token
167778111467962714624302757832749846470
10.XX.XXX.XX us-east 1a Up Normal 628.07 GB 1.39% 1808575600
10.XX.XXX.XX us-east 1d Up Normal 491.85 GB 1.39% 2363071992506517107384545886751410400
10.XX.XXX.XX us-east 1c Up Normal 519.49 GB 1.39% 4726143985013034214769091771694245202
10.XX.XXX.XX us-east 1a Up Normal 507.48 GB 1.39% 7089215977519551322153637656637080002
10.XX.XXX.XX us-east 1d Up Normal 503.12 GB 1.39% 9452287970026068429538183541579914805
10.XX.XXX.XX us-east 1c Up Normal 508.85 GB 1.39% 11815359962532585536922729426522749604
10.XX.XXX.XX us-east 1a Up Normal 497.69 GB 1.39% 14178431955039102644307275311465584408
10.XX.XXX.XX us-east 1d Up Normal 495.2 GB 1.39% 16541503947545619751691821196408419206
10.XX.XXX.XX us-east 1c Up Normal 503.94 GB 1.39% 18904575940052136859076367081351254011
10.XX.XXX.XX us-east 1a Up Normal 624.87 GB 1.39% 21267647932558653966460912966294088808
10.XX.XXX.XX us-east 1d Up Normal 498.78 GB 1.39% 23630719925065171073845458851236923614
10.XX.XXX.XX us-east 1c Up Normal 506.46 GB 1.39% 25993791917571688181230004736179758410
10.XX.XXX.XX us-east 1a Up Normal 501.05 GB 1.39% 28356863910078205288614550621122593217
10.XX.XXX.XX us-east 1d Up Normal 814.26 GB 1.39% 30719935902584722395999096506065428012
10.XX.XXX.XX us-east 1c Up Normal 504.83 GB 1.39% 33083007895091239503383642391008262820
Figure 2: Sample cluster created by PriamAddress DC Rack Status State Load Owns TokenFigure 4: Multi-regional Cassandra cluster created by Priam
170141183460469231731687303715884105727
176.XX.XXX.XX eu-west 1a Up Normal 35.04 GB 0.00% 372748112
184.XX.XXX.XX us-east 1a Up Normal 56.33 GB 8.33% 14178431955039102644307275309657008810
46.XX.XXX.XX eu-west 1b Up Normal 36.64 GB 0.00% 14178431955039102644307275310029756921
174.XX.XXX.XX us-east 1d Up Normal 34.63 GB 8.33% 28356863910078205288614550619314017620
46.XX.XXX.XX eu-west 1c Up Normal 51.82 GB 0.00% 28356863910078205288614550619686765731
50.XX.XXX.XX us-east 1c Up Normal 34.26 GB 8.33% 42535295865117307932921825928971026430
46.XX.XXX.XX eu-west 1a Up Normal 34.39 GB 0.00% 42535295865117307932921825929343774541
184.XX.XXX.XX us-east 1a Up Normal 56.02 GB 8.33% 56713727820156410577229101238628035240
46.XX.XXX.XX eu-west 1b Up Normal 44.55 GB 0.00% 56713727820156410577229101239000783351
107.XX.XXX.XX us-east 1d Up Normal 36.34 GB 8.33% 70892159775195513221536376548285044050
46.XX.XXX.XX eu-west 1c Up Normal 50.1 GB 0.00% 70892159775195513221536376548657792161
50.XX.XXX.XX us-east 1c Up Normal 39.44 GB 8.33% 85070591730234615865843651857942052858
46.XX.XXX.XX eu-west 1a Up Normal 40.86 GB 0.00% 85070591730234615865843651858314800971
174.XX.XXX.XX us-east 1a Up Normal 43.75 GB 8.33% 99249023685273718510150927167599061670
79.XX.XXX.XX eu-west 1b Up Normal 42.43 GB 0.00% 99249023685273718510150927167971809781
- 57 Cassandra clusters running on hundreds of instances are currently in production, many of which are multi-regional
- Priam backs up tens of TBs of data to S3 per day.
- Several TBs of production data is restored into our test environment every week.
- Nodes get replaced almost daily without any manual intervention
- All of our clusters use random partitioner and are well-balanced
- Priam was used to create the 288 node Cassandra benchmark cluster discussed in our earlier blog post[3].
Aegisthus - A Bulk Data Pipeline out of Cassandra
By Charles Smith and Jeff Magnusson
Our job in Data Science and Engineering is to consume all the data that Netflix produces and provide an offline batch-processing platform for analyzing and enriching it. As has been mentioned in previous posts, Netflix has recently been engaged in making the transition to serving a significant amount of data from Cassandra. As with any new data storage technology that is not easily married to our current analytics and reporting platforms, we needed a way to provide a robust set of tools to process and access the data.
With respect to the requirement of bulk processing, there are a couple very basic problems that we need to avoid when acquiring data. First, we don’t want to impact production systems. Second, Netflix is creating an internal infrastructure of decoupled applications, several of which are backed by their own Cassandra cluster. Data Science and Engineering needs to be able to obtain a consistent view of the data across the various clusters.
With these needs in mind and many of our key data sources rapidly migrating from traditional relational database systems into Cassandra, we set out to design a process to extract data from Cassandra and make it available in a generic form that is easily consumable by our bulk analytics platform. Since our desire is to retrieve the data in bulk, we rejected any attempts to query the production clusters directly. While Cassandra is very efficient at serving point queries and we have a lot of great APIs for accessing data here at Netflix, trying to ask a system for all of its data is generally not good for its long or short-term health.
Instead, we wanted to build an offline batch process for extracting the data. A big advantage to hosting our infrastructure on AWS is that we have access to effectively infinite, shared storage on S3. Our production Cassandra clusters are continuously backed up into a S3 bucket using our backup and recovery tool, Priam. Initially we intended to simply bring up a copy of each production cluster from Priam’s backups and extract the data via a Hadoop map-reduce job running against the restored Cassandra cluster. Working forward from that approach, we soon discovered that while it may be a feasible for one or two clusters, maintaining the number of moving parts required to deploy this solution to all of our production clusters was going to quickly become unmaintainable. It just didn’t scale.
So, is there a better way to do it?
Taking at step back, it became evident to us that the problem of achieving scale in this architecture was two-fold. First, the overhead of spinning up a new cluster in AWS and restoring it from a backup did not scale well with the number of clusters being pushed to production. Second, we were operating under the constraint that backups have to be restored into a cluster equal in size to production. As data sizes grow, there is not necessarily any motivation for production data sources to increase the number of nodes in their clusters (remember, they are not bulk querying the data – their workloads don’t scale linearly with respect to data size).
Thus, we were unable to leverage a key benefit of processing data on Hadoop – the ability to easily scale computing resources horizontally with respect to the size of your data.
We realized that Hadoop was an excellent fit for processing the data. The problem was that the Cassandra data was stored in a format that was not natively readable (sstables). Standing up Cassandra clusters from backups was simply a way to circumvent that problem. Rather than try to avoid the real issue, we decided to attack it head-on.
Aegisthus is Born
The end result was an application consisting of a constantly running Hadoop cluster capable of processing sstables as they are created by any Cassandra data source in our architecture. We call it Aegisthus, named in honor of Aegisthus’s relationship with Cassandra in Greek mythology.
Running on a single Hadoop cluster gives us the advantage of being able to easily and elastically scale a single computing resource. We were able to reduce the number of moving parts in our architecture while vastly increasing the speed at which we could process Cassandra’s data.
How it Works
A single map-reduce job is responsible for the bulk of the processing Aegisthus performs. The inputs to this map reduce job are sstables from Cassandra – either a full snapshot of a cluster (backup), or batches of sstables as they are incrementally archived by Priam from the Cassandra cluster. We process the sstables, reduce them into a single consistent view of the data, and convert it to JSON formatted rows that we stage out to S3 to be picked up by the rest of our analytics pipeline.
A full snapshot of a Cassandra cluster consists of all the sstables required to reconstitute the data into a new cluster that is consistent to the point at which the snapshot was taken. We developed an input format that is able to split the sstables across the entire Hadoop cluster, allowing us to control the amount of compute power we want to throw at the processing (horizontal scale). This was a welcome relief after trying to deal with timeout exceptions when directly using Cassandra as a data source for Hadoop input.
Each row-column value written to Cassandra is replicated and stored in sstables with a corresponding timestamp. The map phase of our job reads the sstables and converts them into JSON format. The reduce phase replicates the internal logic Cassandra uses to return data when it is queried with a consistency level of ALL (i.e. it reduces each row-column value based on the max timestamp).
Performance
Aegisthus is currently running on a Hadoop cluster consisting of 24 m2.4xlarge EC2 instances. In the table below, we show some benchmarks for a subset of the Cassandra clusters from which we are pulling data. The table below shows the number of nodes in the Cassandra cluster that houses the data, the average size of data per node, the total number of rows in the dataset, the time our map/reduce job takes to run, and the number or row/sec we are able to process.
The number of rows/sec is highly variable across data sources. This is due to a number of reasons, notably the average size of the rows and the average number of times a row is replicated across the sstables. Further, as can be seen in the last entry in the table, smaller datasets incur a noticeable penalty due to overhead in the map/reduce framework.
We’re constantly optimizing our process and have tons of other interesting and challenging problems to solve. Like what you see? We’re hiring!
Fault Tolerance in a High Volume, Distributed System
In an earlier post by Ben Schmaus, we shared the principles behind our circuit-breaker implementation. In that post, Ben discusses how the Netflix API interacts with dozens of systems in our service-oriented architecture, which makes the API inherently more vulnerable to any system failures or latencies underneath it in the stack. The rest of this post provides a more technical deep-dive into how our API and other systems isolate failure, shed load and remain resilient to failures.
Fault Tolerance is a Requirement, Not a Feature
The Netflix API receives more than 1 billion incoming calls per day which in turn fans out to several billion outgoing calls (averaging a ratio of 1:6) to dozens of underlying subsystems with peaks of over 100k dependency requests per second.
This all occurs in the cloud across thousands of EC2 instances.
Intermittent failure is guaranteed with this many variables, even if every dependency itself has excellent availability and uptime.
Without taking steps to ensure fault tolerance, 30 dependencies each with 99.99% uptime would result in 2+ hours downtime/month (99.99%30 = 99.7% uptime = 2+ hours in a month).
When a single API dependency fails at high volume with increased latency (causing blocked request threads) it can rapidly (seconds or sub-second) saturate all available Tomcat (or other container such as Jetty) request threads and take down the entire API.
Thus, it is a requirement of high volume, high availability applications to build fault tolerance into their architecture and not expect infrastructure to solve it for them.
Netflix DependencyCommand Implementation
The service-oriented architecture at Netflix allows each team freedom to choose the best transport protocols and formats (XML, JSON, Thrift, Protocol Buffers, etc) for their needs so these approaches may vary across services.
In most cases the team providing a service also distributes a Java client library.
Because of this, applications such as API in effect treat the underlying dependencies as 3rd party client libraries whose implementations are "black boxes". This in turn affects how fault tolerance is achieved.
In light of the above architectural considerations we chose to implement a solution that uses a combination of fault tolerance approaches:
- network timeouts and retries
- separate threads on per-dependency thread pools
- semaphores (via a tryAcquire, not a blocking call)
- circuit breakers
The Netflix DependencyCommand implementation wraps a network-bound dependency call with a preference towards executing in a separate thread and defines fallback logic which gets executed (step 8 in flow chart below) for any failure or rejection (steps 3, 4, 5a, 6b below) regardless of which type of fault tolerance (network or thread timeout, thread pool or semaphore rejection, circuit breaker) triggered it.
![]() |
Click to enlarge |
We decided that the benefits of isolating dependency calls into separate threads outweighs the drawbacks (in most cases). Also, since the API is progressively moving towards increased concurrency it was a win-win to achieve both fault tolerance and performance gains through concurrency with the same solution. In other words, the overhead of separate threads is being turned into a positive in many use cases by leveraging the concurrency to execute calls in parallel and speed up delivery of the Netflix experience to users.
Thus, most dependency calls now route through a separate thread-pool as the following diagram illustrates:
If a dependency becomes latent (the worst-case type of failure for a subsystem) it can saturate all of the threads in its own thread pool, but Tomcat request threads will timeout or be rejected immediately rather than blocking.
![]() |
Click to enlarge |
In addition to the isolation benefits and concurrent execution of dependency calls we have also leveraged the separate threads to enable request collapsing (automatic batching) to increase overall efficiency and reduce user request latencies.
Semaphores are used instead of threads for dependency executions known to not perform network calls (such as those only doing in-memory cache lookups) since the overhead of a separate thread is too high for these types of operations.
We also use semaphores to protect against non-trusted fallbacks. Each DependencyCommand is able to define a fallback function (discussed more below) which is performed on the calling user thread and should not perform network calls. Instead of trusting that all implementations will correctly abide to this contract, it too is protected by a semaphore so that if an implementation is done that involves a network call and becomes latent, the fallback itself won't be able to take down the entire app as it will be limited in how many threads it will be able to block.
Despite the use of separate threads with timeouts, we continue to aggressively set timeouts and retries at the network level (through interaction with client library owners, monitoring, audits etc).
The timeouts at the DependencyCommand threading level are the first line of defense regardless of how the underlying dependency client is configured or behaving but the network timeouts are still important otherwise highly latent network calls could fill the dependency thread-pool indefinitely.
The tripping of circuits kicks in when a DependencyCommand has passed a certain threshold of error (such as 50% error rate in a 10 second period) and will then reject all requests until health checks succeed.
This is used primarily to release the pressure on underlying systems (i.e. shed load) when they are having issues and reduce the user request latency by failing fast (or returning a fallback) when we know it is likely to fail instead of making every user request wait for the timeout to occur.
How do we respond to a user request when failure occurs?
In each of the options described above a timeout, thread-pool or semaphore rejection, or short-circuit will result in a request not retrieving the optimal response for our customers.
An immediate failure ("fail fast") throws an exception which causes the app to shed load until the dependency returns to health. This is preferable to requests "piling up" as it keeps Tomcat request threads available to serve requests from healthy dependencies and enables rapid recovery once failed dependencies recover.
However, there are often several preferable options for providing responses in a "fallback mode" to reduce impact of failure on users. Regardless of what causes a failure and how it is intercepted (timeout, rejection, short-circuited etc) the request will always pass through the fallback logic (step 8 in flow chart above) before returning to the user to give a DependencyCommand the opportunity to do something other than "fail fast".
Some approaches to fallbacks we use are, in order of their impact on the user experience:
- Cache: Retrieve data from local or remote caches if the realtime dependency is unavailable, even if the data ends up being stale
- Eventual Consistency: Queue writes (such as in SQS) to be persisted once the dependency is available again
- Stubbed Data: Revert to default values when personalized options can't be retrieved
- Empty Response ("Fail Silent"): Return a null or empty list which UIs can then ignore
Example Use Case
Following is an example of how threads, network timeouts and retries combine:
The above diagram shows an example configuration where the dependency has no reason to hit the 99.5th percentile and thus cuts it short at the network timeout layer and immediately retries with the expectation to get median latency most of the time, and accomplish this all within the 300ms thread timeout.
If the dependency has legitimate reasons to sometimes hit the 99.5th percentile (i.e. cache miss with lazy generation) then the network timeout will be set higher than it, such as at 325ms with 0 or 1 retries and the thread timeout set higher (350ms+).
The threadpool is sized at 10 to handle a burst of 99th percentile requests, but when everything is healthy this threadpool will typically only have 1 or 2 threads active at any given time to serve mostly 40ms median calls.
When configured correctly a timeout at the DependencyCommand layer should be rare, but the protection is there in case something other than network latency affects the time, or the combination of connect+read+retry+connect+read in a worst case scenario still exceeds the configured overall timeout.
The aggressiveness of configurations and tradeoffs in each direction are different for each dependency.
Configurations can be changed in realtime as needed as performance characteristics change or when problems are found all without risking the taking down of the entire app if problems or misconfigurations occur.
Conclusion
The approaches discussed in this post have had a dramatic effect on our ability to tolerate and be resilient to system, infrastructure and application level failures without impacting (or limiting impact to) user experience.
Despite the success of this new DependencyCommand resiliency system over the past 8 months, there is still a lot for us to do in improving our fault tolerance strategies and performance, especially as we continue to add functionality, devices, customers and international markets.
If these kinds of challenges interest you, the API team is actively hiring:
JMeter Plugin for Cassandra
A number of previous blogs have discussed our adoption of Cassandra as a NoSQL solution in the cloud. We now have over 55 Cassandra clusters in the cloud and are moving our source of truth from our Datacenter to these Cassandra clusters. As part of this move we have not only contributed to Cassandra itself but developed software to ease its deployment and use. It is our plan to open source as much of this software as possible.
We recently announced the open sourcing of Priam, which is a co-process that runs alongside Cassandra on every node to provide backup and recovery, bootstrapping, token assignment, configuration management and a RESTful interface to monitoring and metrics. In January we also announced our Cassandra Java client Astyanax which is built on top of Thrift and provides lower latency, reduced latency variance, and better error handling.
At Netflix we have recently started to standardize our load testing across the fleet using Apache JMeter. As Cassandra is a key part of our infrastructure that needs to be tested we developed a JMeter plugin for Cassandra. In this blog we discuss the plugin and present performance data for Astyanax vs Thrift collected using this plugin.
Cassandra JMeter Plugin
JMeter allows us to customize our test cases based on our application logic/datamodel. The Cassandra JMeter plugin we are releasing today is described on the github wiki here. It consists of a jar file that is placed in JMeter's lib/ext directory. The instructions to build and install the jar file are here.
An example screenshot is shown below.

Benchmark Setup
We set up a simple 6-node Cassandra cluster using EC2 m2.4xlarge instances, and the following schema
create keyspace MemberKeySp
with placement_strategy =
'NetworkTopologyStrategy'
and strategy_options = [{us-east :
3
}]
and durable_writes =
true
;
use MemberKeySp;
create column family Customer
with column_type =
'Standard'
and comparator =
'UTF8Type'
and default_validation_class =
'BytesType'
and key_validation_class =
'UTF8Type'
and rows_cached =
0.0
and keys_cached =
100000.0
and read_repair_chance =
0.0
and comment =
'Customer Records'
;
Six million rows were then inserted into the cluster with a replication factor 3. Each row has 19 columns of simple ascii data. Total data set is 2.9GB per node so easily cacheable in our instances which have 68GB of memory. We wanted to test the latency of the client implementation using a single Get Range Slice operation ie 100% Read only. Each test was run twice to ensure the data was indeed cached, confirmed with iostat. One hundred JMeter threads were used to apply the load with 100 connections from JMeter to each node of Cassandra. Each JMeter thread therefore has at least 6 connections to choose from when sending it's request to Cassandra.
Every Cassandra JMeter Thread Group has a Config Element called CassandraProperties which contains clientType amongst other properties. For Astyanax clientType is set t0 com.netflix.jmeter.connections.a6x.AstyanaxConnection, for Thrift com.netflix.jmeter.connections.thrift.ThriftConnection.
Token Aware is the default JMeter setting. If you wish to experiment with other settings create a properties file, cassandra.properties, in the JMeter home directory with properties from the list below.
astyanax.connection.discovery=
astyanax.connection.pool=
astyanax.connection.latency.stategy=
Results
Transaction throughput
This graph shows the throughput at 5 second intervals for the Token Aware client vs the Thrift client. Token aware is consistently higher than Thrift and its average is 3% better throughput

Average Latency
JMeter reports response times to millisecond granularity. The Token Aware implementation responds in 2ms the majority of the time with occasional 3ms periods, the average is 2.29ms. The Thrift implementation is consistently at 3ms. So Astyanax has about a 30% better response time than raw Thrift implementation without token aware connection pool.
The plugin provides a wide range of samplers for Put, Composite Put, Batch Put, Get, Composite Get, Range Get and Delete. The github wiki has examples for all these scenarios including jmx files to try. Usually we develop the test scenario using the GUI on our laptops and then deploy to the cloud for load testing using the non-GUI version. We often deploy on a number of drivers in order to apply the required level of load.
The data for the above benchmark was also collected using a tool called casstat which we are also making available in the repository. Casstat is a bash script that calls other tools at regular intervals, compares the data with its previous sample, normalizes it on a per second basis and displays the pertinent data on a single line. Under the covers casstat uses
- Cassandra nodetool cfstats to get Column Family performance data
- nodetool tpstats to get internal state changes
- nodetool cfhistograms to get 95th and 99th percentile response times
- nodetool compactionstats to get details on number and type of compactions
- iostat to get disk and cpu performance data
- ifconfig to calculate network bandwidth
An example output is below (note some fields have been removed and abbreviated to reduce the width)
Epoch Rds/s RdLat ... %user %sys %idle .... md0r/s w/s rMB/s wMB/s NetRxK NetTxK Percentile Read Write Compacts
133
...
5657
0.085
...
7.74
10.09
81.73
...
0.00
2.00
0.00
0.05
9083
63414
99th
0.179
ms 95th
0.14
ms 99th
0.00
ms 95th
0.00
ms Pen/
0
133
...
5635
0.083
...
7.65
10.12
81.79
...
0.00
0.30
0.00
0.00
9014
62777
99th
0.179
ms 95th
0.14
ms 99th
0.00
ms 95th
0.00
ms Pen/
0
133
...
5615
0.085
...
7.81
10.19
81.54
...
0.00
0.60
0.00
0.00
9003
62974
99th
0.179
ms 95th
0.14
ms 99th
0.00
ms 95th
0.00
ms Pen/
0
We merge the casstat data from each Cassandra node and then use gnuplot to plot throughput etc.
The Cassandra JMeter plugin has become a key part of our load testing environment. We hope the wider community also finds it useful.
Testing Netflix on Android
- We have at least one device for each playback pipeline architecture we support (The app uses several approaches for video playback on Android such as hardware decoder, software decoder, OMX-AL, iOMX).
- We choose devices with high and low end processors as well as devices with different memory capabilities.
- We have representatives that support each major operating system by make in addition to supporting custom ROMs (most notably CM7, CM9).
- We choose devices that are most heavily used by Netflix Subscribers.
Netflix Recommendations: Beyond the 5 stars (Part 1)
In this two-part blog post, we will open the doors of one of the most valued Netflix assets: our recommendation system. In Part 1, we will relate the Netflix Prize to the broader recommendation challenge, outline the external components of our personalized service, and highlight how our task has evolved with the business. In Part 2, we will describe some of the data and models that we use and discuss our approach to algorithmic innovation that combines offline machine learning experimentation with online AB testing. Enjoy... and remember that we are always looking for more star talent to add to our great team, so please take a look at our jobs page.
The Netflix Prize and the Recommendation Problem
In 2006 we announced the Netflix Prize, a machine learning and data mining competition for movie rating prediction. We offered $1 million to whoever improved the accuracy of our existing system called Cinematch by 10%. We conducted this competition to find new ways to improve the recommendations we provide to our members, which is a key part of our business. However, we had to come up with a proxy question that was easier to evaluate and quantify: the root mean squared error (RMSE) of the predicted rating. The race was on to beat our RMSE of 0.9525 with the finish line of reducing it to 0.8572 or less.
From US DVDs to Global Streaming
One of the reasons our focus in the recommendation algorithms has changed is because Netflix as a whole has changed dramatically in the last few years. Netflix launched an instant streaming service in 2007, one year after the Netflix Prize began. Streaming has not only changed the way our members interact with the service, but also the type of data available to use in our algorithms. For DVDs our goal is to help people fill their queue with titles to receive in the mail over the coming days and weeks; selection is distant in time from viewing, people select carefully because exchanging a DVD for another takes more than a day, and we get no feedback during viewing. For streaming members are looking for something great to watch right now; they can sample a few videos before settling on one, they can consume several in one session, and we can observe viewing statistics such as whether a video was watched fully or only partially.
Everything is a Recommendation
We have discovered through the years that there is tremendous value to our subscribers in incorporating recommendations to personalize as much of Netflix as possible. Personalization starts on our homepage, which consists of groups of videos arranged in horizontal rows. Each row has a title that conveys the intended meaningful connection between the videos in that group. Most of our personalization is based on the way we select rows, how we determine what items to include in them, and in what order to place those items.


Some of the most recognizable personalization in our service is the collection of “genre” rows. These range from familiar high-level categories like "Comedies" and "Dramas" to highly tailored slices such as "Imaginative Time Travel Movies from the 1980s". Each row represents 3 layers of personalization: the choice of genre itself, the subset of titles selected within that genre, and the ranking of those titles. Members connect with these rows so well that we measure an increase in member retention by placing the most tailored rows higher on the page instead of lower. As with other personalization elements, freshness and diversity is taken into account when deciding what genres to show from the thousands possible.


Similarity is also an important source of personalization in our service. We think of similarity in a very broad sense; it can be between movies or between members, and can be in multiple dimensions such as metadata, ratings, or viewing data. Furthermore, these similarities can be blended and used as features in other models. Similarity is used in multiple contexts, for example in response to a member's action such as searching or adding a title to the queue. It is also used to generate rows of “adhoc genres” based on similarity to titles that a member has interacted with recently. If you are interested in a more in-depth description of the architecture of the similarity system, you can read about it in this past post on the blog.


Introducing Exhibitor - A Supervisor System for Apache ZooKeeper
by Jordan Zimmerman
ZooKeeper
ZooKeeper is a high-performance coordination service for distributed applications. We've already open sourced a client library for ZooKeeper, Curator. In addition to Curator for clients, we found a need for a supervisor service that runs alongside ZooKeeper server instances. Thus, we are introducing Exhibitor and open sourcing it.
ZooKeeper Administrative Issues
Managing a ZooKeeper cluster requires a lot of manual effort — see the ZooKeeper Administrator's Guide for details. In particular, ZooKeeper is statically configured. The instances that comprise a ZooKeeper ensemble must be hard coded into a configuration file that must be identical on each ZooKeeper instance. Once the ZooKeeper instances are started it's not possible to reconfigure the ensemble without updating the configuration file and restarting the instances. If not properly done, ZooKeeper can lose quorum and client's can perceive the ensemble as being unavailable.
In addition to static configuration issues, ZooKeeper requires regular maintenance. When using ZooKeeper versions prior to 3.4.x you are advised to periodically clean up the ZooKeeper log files. Also, you are advised to have a monitor of some kind to assure that each ZooKeeper instance is up and serving requests.
Exhibitor Features
Exhibitor provides a number of features that make managing a ZooKeeper ensemble much easier:
- Instance Monitoring: Each Exhibitor instance monitors the ZooKeeper server running on the same server. If ZooKeeper is not running (due to crash, etc.), Exhibitor will rewrite the zoo.cfg file and restart it.
- Log Cleanup: In versions prior to ZooKeeper 3.4.x log file maintenance is necessary. Exhibitor will periodically do this maintenance.
- Backup/Restore: Exhibitor can periodically backup the ZooKeeper transaction files. Once backed up, you can index any of these transaction files. Once indexed, you can search for individual transactions and “replay” them to restore a given ZNode to ZooKeeper.
- Cluster-wide Configuration: Exhibitor attempts to present a single console for your entire ZooKeeper ensemble. Configuration changes made in Exhibitor will be applied to the entire ensemble.
- Rolling Ensemble Changes: Exhibitor can update the servers in the ensemble in a rolling fashion so that the ZooKeeper ensemble can stay up and in quorum while the changes are being made.
- Visualizer: Exhibitor provides a graphical tree view of the ZooKeeper ZNode hierarchy.
- Curator Integration: Exhibitor and Curator (Cur/Ex!) can be configured to work together so that Curator instances are updated for changes in the ensemble.
- Rich REST API: Exhibitor exposes a REST API for programmatic integration.
Easy To Use GUI
Exhibitor is an easy to use web application with a modern UI:
Easy To Integrate
There are two versions of Exhibitor:
- Standalone: The standalone version comes pre-configured as a Jetty-based self-contained application.
- Core: The core version can be integrated into an existing application or you can build an extended application around it.
For More Information...
- Exhibitor binaries are posted to Maven Central.
- The source code for Exhibitor is hosted at Github: https://github.com/Netflix/exhibitor
- Extensive documentation is currently at https://github.com/Netflix/exhibitor/wiki
We're Hiring!
Like what you see? Netflix is a great place for programmers. Check out our Jobs Board today.
Netflix Joins World IPv6 Launch

Netflix Operations: Part I, Going Distributed
Moving to the cloud presented new challenges for us[1] and forced us to develop new design patterns for running a reliable and resilient distributed system[2]. We’ve focused many of our past posts on the technical hurdles we overcame to run successfully in the cloud. However, we had to make operational and organizational transformations as well. We want to share the way we think about operations at Netflix to help others going through a similar journey. In putting this post together, we realized there’s so much to share that we decided to make this a first in a series of posts on operations at Netflix.
The old guard
When we were running out of our data center, Netflix was a large monolithic Java application running inside of a tomcat container. Every two weeks, the deployment train left at exactly the same time and anyone wanting to deploy a production change needed to have their code checked-in and tested before departure time. This also meant that anyone could check-in bad code and bring the entire train to a halt while the issue was diagnosed and resolved. Deployments were heavy and risk-laden and, because of all the moving parts going into each deployment, it was handled by a centralized team that was part of ITOps.
Production support was similarly centralized within ITOps. We had a traditional NOC that monitored charts and graphs and was called when a service interruption occurred. They were organizationally separate from the development team. More importantly, there was a large cultural divide between the operations and development teams because of the mismatched goals of site uptime versus features and velocity of innovation.
Built for scale in the cloud
In moving to the cloud, we saw an opportunity to recast the mold for how we build and deploy our software. We used the cloud migration as an opportunity to re-architect our system into a service oriented architecture with hundreds of individual services. Each service could be revved on its own deployment schedule, often weekly, empowering each team to deliver innovation at its own desired pace. We unwound the centralized deployment team and distributed the function into the teams that owned each service.
Post-deployment support was similarly distributed as part of the cloud migration. The NOC was disbanded and a new Site Reliability Engineering team was created within the development organization not to operate the system, but to provide system-wide analysis and development around reliability and resiliency.
The road to a distributed future
As the scale of web applications has grown over time due to the addition of features and growth of usage, the application architecture has changed radically. There are a number of things that exemplify this: service oriented architecture, eventually consistent data stores, map-reduce, etc. The fundamental thing that they all share is a distributed architecture that involves numerous applications, servers and interconnections. For Netflix this meant moving from a few teams checking code into a large monolithic application running on tens of servers to having tens of engineering teams developing hundreds of component services that run on thousands of servers.
![]() |
The Netflix distributed system |
As we grew, it quickly became clear that centralized operations was not well suited for our new use case. Our production environment is too complex for any one team or organization to understand well, which meant that they were forced to either make ill-informed decisions based on their perceptions, or get caught in a game of telephone tag with different development teams. We also didn’t want our engineering teams to be tightly coupled to each other when they were making changes to their applications.
In addition to distributing the operations experience throughout development, we also heavily invested in tools and automation. We created a number of engineering teams to focus on high volume monitoring and event correlation, end-to-end continuous integration and builds, and automated deployment tools[3][4]. These tools are critical to limiting the amount of extra work developers must do in order to manage the environment while also providing them with the information that they need to make smart decisions about when and how they deploy, vet and diagnose issues with each new code deployment.
Our architecture and code base evolved and adapted to our new cloud-based environment. Our operations have evolved as well. Both aim to be distributed and scalable. Once a centralized function, operations is now distributed throughout the development organization. Successful operations at Netflix is a distributed system, much like our software, that relies on algorithms, tools, and automation to scale to meet the demands of our ever-growing user-base and product.
In future posts, we’ll explore the various aspects of operations at Netflix in more depth. If you want to see any area explored in more detail, comment below or tweet us.
If you’re passionate about building and running massive-scale web applications, we’re always looks for amazing developers and site reliability engineers. See all our open positions at www.netflix.com/jobs.
- Ariel Tseitlin (@atseitlin), Director of Cloud Solutions
- Greg Orzell (@chaossimia), Cloud & Platform Engineering Architect
[1] http://techblog.netflix.com/2010/12/5-lessons-weve-learned-using-aws.html
[2] http://techblog.netflix.com/2011/04/lessons-netflix-learned-from-aws-outage.html
[3] http://www.slideshare.net/joesondow/asgard-the-grails-app-that-deploys-netflix-to-the-cloud
[4] http://www.slideshare.net/carleq/building-cloudtoolsfornetflixcode-mash2012
Announcing Archaius: Dynamic Properties in the Cloud
Netflix has a culture of being dynamic when it comes to decision making. This trait comes across both in the business domain as well as in technology and operations.
It follows that we like the ability to effect changes in the behavior of our deployed services dynamically at run-time. Availability is of the utmost importance to us, so we would like to accomplish this without having to bounce servers.
Furthermore, we want the ability to dynamically change properties (and hence the logic and behavior of our services) based on a request or deployment context. For example, we want to configure properties for an application instance or request, based on factors like the Amazon Region the service is deployed in, the country of origin (of the request), the device the movie is playing on etc.
What is Archaius?
Archaius, is the dynamic, multi dimensional, properties framework that addresses these requirements and use cases.
The code name for the project comes from an endangered species of Chameleons. More information can be found at http://en.wikipedia.org/wiki/Archaius_tigris. We chose Archaius, as Chameleons are known for changing their color (a property) based on their environment and situation.
We are pleased to announce the public availability of Archaius as an important milestone in our continued goal of open sourcing the Netflix Platform Stack. (Available at http://github.com/netflix)
Why Archaius?
To understand why we built Archaius, we need to enumerate the pain points of configuration management and the ecosystem that the system operates in. Some of these are captured below, and drove the requirements.- Static updates require server pushes; this was operationally undesirable and caused a dent in the availability of the service/application.
- A Push method of updating properties could not be employed as this system would need to know all the server instances to push the configuration to at any given point in time ((i.e. the list of hostnames and property locations).
- This was a possibility in our own data center where we owned all the servers. In the cloud, the instances are ephemeral and their hostnames/ip addresses are not known in advance. Furthermore, the number of these instances fluctuate based on the ASG settings. (for more information on how Netflix uses Auto Scaling Group feature of AWS, please visit here or here).
- Given that property changes had to be applied at run time, it was clear that the codebase had to use a common mechanism which allowed it to consume properties in a uniform manner, from different sources (both static and dynamic).
- There was a need to have different properties for different applications and services under different contexts. See the section "Netflix Deployment Overview" for an overview of services and context.
- Property changes needed to be journaled. This allowed us to correlate any issues in production to a corresponding run time property change.
- Properties had to be applied based on the Context. i.e. The property had to be multi dimensional. At Netflix, the context was based on "dimensions" such as Environment (development, test, production), Deployed Region (us-east-1, us-west-1 etc.), "Stack" (a concept in which each app and the services in its dependency graph were isolated for a specific purpose; e.g. "iPhone App launch Stack") etc.
Use Cases/Examples
- Enable or disable certain features based on the request context.
- A UI presentation logic layer may have a default configuration to display 10 Movie Box Shots in a single display row. If we determine that we would like to display 5 instead, we can do so using Archaius' Dynamic Properties.
- We can override the behaviors of the circuit breakers. Reference: Resiliency and Circuit breakers
- Connection and request timeouts for calls to internal and external services can be adjusted as needed
- In case we get alerted on errors observed in certain services, we can change the Log Levels (i.e. DEBUG, WARN etc.) dynamically for particular packages/components on these services. This enables us to parse the log files to inspect these errors. Once we are done inspecting the logs, we can reset the Log Levels using Dynamic Properties.
- Now that Netflix is deployed in an ever growing global infrastructure, Dynamic Properties allow us to enable different characteristics and features based on the International market.
- Certain infrastructural components benefit from having configurations changed at Runtime based on aggregate site wide behavior. For e.g. a distributed cache component's TTL (time to live) can be changed at runtime based on external factors.
- Connection pools had to be set differently for the same client library based on which application/service it was deployed in. (For example, in a light weight, low Requests Per Second (RPS) application, the number of connections in a connection pool to a particular service/db will be set to a lower number compared to a high RPS application)
- The changes in properties can be effected on on a particular instance, a particular region, a stack of deployed services or an entire farm of a particular application at run-time.
Netflix Deployment Overview
Example Deployment Context
- Environment = TEST
- Region = us-east-1
- Stack = MyTestStack
- AppName = cherry
Every service or application has a unique "AppName" associated with it. Most services at Netflix are stateless and hosted on multiple instances deployed across multiple Availability Zones of an Amazon Region. The available environments could be "test" or "production" etc. A Stack is logical grouping. For example, an Application and the Mid-Tier Services in its dependency graph can all be logically grouped as belonging to a Stack called "MyTestStack". This is typically done to run different tests on isolated and controlled deployments.
The red oval boxes in the diagram above called "Shared Libraries" are the various common code used by multiple applications. For example, Astyanax, our open sourced Cassandra Client is one such shared library. Turns out that we may need to configure the connection pool differently for each of the applications that is using the Astyanax library. Furthermore it could vary in different Amazon Regions and within different "Stacks" of deployments. Sometimes, we may want to tweak this connection pool parameter at runtime. These are the capabilities that Archaius offers.
i.e. The ability to specifically target a subset or an aggregation of components with a view towards configuring their behavior at static (initial loading) or runtime is what enables us to address the use cases outlined above.
The examples and diagrams in this article show a representative view of how Archaius is used at Netflix. Archaius, the Open sourced version of the project is configurable and extendable to meet your specific needs and deployment environment (even if your deployment of choice is not the EC2 Cloud).
Overview of Archaius
Archaius includes a set of java configuration management APIs that are used at Netflix. It is primarily implemented as an extension of Apache's Common Configuration library. Notable features are:
- Dynamic, Typed Properties
- High throughput and Thread Safe Configuration operations
- A polling framework that allows for obtaining property changes from a Configuration Source
- A Callback mechanism that gets invoked on effective/"winning" property mutations (in the ordered hierarchy of Configurations)
- A JMX MBean that can be accessed via JConsole to inspect and invoke operations on properties
A rough template for handling a request and using Dynamic Property based execution is shown below:
void
handleFeatureXYZRequest(Request params ...){
if
(featureXYZDynamicProperty.get().equals(
"useLongDescription"
){
showLongDescription();
}
else
{
showShortSnippet();
}
}
References
Conclusion
Archaius forms an important component of the Netflix Cloud Platform. It offers the ability to control various sub systems and components at runtime without any impact to the availability of the services. We hope that this is a useful addition to the list of projects open sourced by Netflix, and invite the open source community to help us improve Archaius and other components.Interested in helping us take Netflix Cloud Platform to the next level? We are looking for talented engineers.
- Allen Wang, Sr. Software Engineer, Cloud Platform (Core Infrastructure)
- Sudhir Tonse (@stonse), Manager, Cloud Platform (Core Infrastructure)
Netflix Recommendations: Beyond the 5 stars (Part 2)
In part one of this blog post, we detailed the different components of Netflix personalization. We also explained how Netflix personalization, and the service as a whole, have changed from the time we announced the Netflix Prize.The $1M Prize delivered a great return on investment for us, not only in algorithmic innovation, but also in brand awareness and attracting stars (no pun intended) to join our team. Predicting movie ratings accurately is just one aspect of our world-class recommender system. In this second part of the blog post, we will give more insight into our broader personalization technology. We will discuss some of our current models, data, and the approaches we follow to lead innovation and research in this space.
Ranking
The goal of recommender systems is to present a number of attractive items for a person to choose from. This is usually accomplished by selecting some items and sorting them in the order of expected enjoyment (or utility). Since the most common way of presenting recommended items is in some form of list, such as the various rows on Netflix, we need an appropriate ranking model that can use a wide variety of information to come up with an optimal ranking of the items for each of our members.If you are looking for a ranking function that optimizes consumption, an obvious baseline is item popularity. The reason is clear: on average, a member is most likely to watch what most others are watching. However, popularity is the opposite of personalization: it will produce the same ordering of items for every member. Thus, the goal becomes to find a personalized ranking function that is better than item popularity, so we can better satisfy members with varying tastes.
Recall that our goal is to recommend the titles that each member is most likely to play and enjoy. One obvious way to approach this is to use the member's predicted rating of each item as an adjunct to item popularity. Using predicted ratings on their own as a ranking function can lead to items that are too niche or unfamiliar being recommended, and can exclude items that the member would want to watch even though they may not rate them highly. To compensate for this, rather than using either popularity or predicted rating on their own, we would like to produce rankings that balance both of these aspects. At this point, we are ready to build a ranking prediction model using these two features.
There are many ways one could construct a ranking function ranging from simple scoring methods, to pairwise preferences, to optimization over the entire ranking. For the purposes of illustration, let us start with a very simple scoring approach by choosing our ranking function to be a linear combination of popularity and predicted rating. This gives an equation of the form frank(u,v) = w1 p(v) + w2 r(u,v) + b, where u=user, v=video item, p=popularity and r=predicted rating. This equation defines a two-dimensional space like the one depicted below.
Once we have such a function, we can pass a set of videos through our function and sort them in descending order according to the score. You might be wondering how we can set the weights w1 and w2 in our model (the bias b is constant and thus ends up not affecting the final ordering). In other words, in our simple two-dimensional model, how do we determine whether popularity is more or less important than predicted rating? There are at least two possible approaches to this. You could sample the space of possible weights and let the members decide what makes sense after many A/B tests. This procedure might be time consuming and not very cost effective. Another possible answer involves formulating this as a machine learning problem: select positive and negative examples from your historical data and let a machine learning algorithm learn the weights that optimize your goal. This family of machine learning problems is known as "Learning to rank" and is central to application scenarios such as search engines or ad targeting. Note though that a crucial difference in the case of ranked recommendations is the importance of personalization: we do not expect a global notion of relevance, but rather look for ways of optimizing a personalized model.
As you might guess, apart from popularity and rating prediction, we have tried many other features at Netflix. Some have shown no positive effect while others have improved our ranking accuracy tremendously. The graph below shows the ranking improvement we have obtained by adding different features and optimizing the machine learning algorithm.
Many supervised classification methods can be used for ranking. Typical choices include Logistic Regression, Support Vector Machines, Neural Networks, or Decision Tree-based methods such as Gradient Boosted Decision Trees (GBDT). On the other hand, a great number of algorithms specifically designed for learning to rank have appeared in recent years such as RankSVM or RankBoost. There is no easy answer to choose which model will perform best in a given ranking problem. The simpler your feature space is, the simpler your model can be. But it is easy to get trapped in a situation where a new feature does not show value because the model cannot learn it. Or, the other way around, to conclude that a more powerful model is not useful simply because you don't have the feature space that exploits its benefits.
Data and Models
The previous discussion on the ranking algorithms highlights the importance of both data and models in creating an optimal personalized experience for our members. At Netflix, we are fortunate to have many relevant data sources and smart people who can select optimal algorithms to turn data into product features. Here are some of the data sources we can use to optimize our recommendations:- We have several billion item ratings from members. And we receive millions of new ratings a day.
- We already mentioned item popularity as a baseline. But, there are many ways to compute popularity. We can compute it over various time ranges, for instance hourly, daily, or weekly. Or, we can group members by region or other similarity metrics and compute popularity within that group.
- We receive several million stream plays each day, which include context such as duration, time of day and device type.
- Our members add millions of items to their queues each day.
- Each item in our catalog has rich metadata: actors, director, genre, parental rating, and reviews.
- Presentations: We know what items we have recommended and where we have shown them, and can look at how that decision has affected the member's actions. We can also observe the member's interactions with the recommendations: scrolls, mouse-overs, clicks, or the time spent on a given page.
- Social data has become our latest source of personalization features; we can process what connected friends have watched or rated.
- Our members directly enter millions of search terms in the Netflix service each day.
- All the data we have mentioned above comes from internal sources. We can also tap into external data to improve our features. For example, we can add external item data features such as box office performance or critic reviews.
- Of course, that is not all: there are many other features such as demographics, location, language, or temporal data that can be used in our predictive models.
- Linear regression
- Logistic regression
- Elastic nets
- Singular Value Decomposition
- Restricted Boltzmann Machines
- Markov Chains
- Latent Dirichlet Allocation
- Association Rules
- Gradient Boosted Decision Trees
- Random Forests
- Clustering techniques from the simple k-means to novel graphical approaches such as Affinity Propagation
- Matrix factorization
Consumer Data Science
The abundance of source data, measurements and associated experiments allow us to operate a data-driven organization. Netflix has embedded this approach into its culture since the company was founded, and we have come to call it Consumer (Data) Science. Broadly speaking, the main goal of our Consumer Science approach is to innovate for members effectively. The only real failure is the failure to innovate; or as Thomas Watson Sr, founder of IBM, put it: “If you want to increase your success rate, double your failure rate.” We strive for an innovation culture that allows us to evaluate ideas rapidly, inexpensively, and objectively. And, once we test something we want to understand why it failed or succeeded. This lets us focus on the central goal of improving our service for our members.So, how does this work in practice? It is a slight variation over the traditional scientific process called A/B testing (or bucket testing):
1. Start with a hypothesis
2. Design a test
- Algorithm/feature/design X will increase member engagement with our service and ultimately member retention
3. Execute the test
- Develop a solution or prototype. Ideal execution can be 2X as effective as a prototype, but not 10X.
- Think about dependent & independent variables, control, significance…
4. Let data speak for itself
When we execute A/B tests, we track many different metrics. But we ultimately trust member engagement (e.g. hours of play) and retention. Tests usually have thousands of members and anywhere from 2 to 20 cells exploring variations of a base idea. We typically have scores of A/B tests running in parallel. A/B tests let us try radical ideas or test many approaches at the same time, but the key advantage is that they allow our decisions to be data-driven. You can read more about our approach to A/B Testing in this previous tech blog post or in some of the Quora answers by our Chief Product Officer Neil Hunt.
An interesting follow-up question that we have faced is how to integrate our machine learning approaches into this data-driven A/B test culture at Netflix. We have done this with an offline-online testing process that tries to combine the best of both worlds. The offline testing cycle is a step where we test and optimize our algorithms prior to performing online A/B testing. To measure model performance offline we track multiple metrics used in the machine learning community: from ranking measures such as normalized discounted cumulative gain, mean reciprocal rank, or fraction of concordant pairs, to classification metrics such as accuracy, precision, recall, or F-score. We also use the famous RMSE from the Netflix Prize or other more exotic metrics to track different aspects like diversity. We keep track of how well those metrics correlate to measurable online gains in our A/B tests. However, since the mapping is not perfect, offline performance is used only as an indication to make informed decisions on follow up tests.
Once offline testing has validated a hypothesis, we are ready to design and launch the A/B test that will prove the new feature valid from a member perspective. If it does, we will be ready to roll out in our continuous pursuit of the better product for our members. The diagram below illustrates the details of this process.
An extreme example of this innovation cycle is what we called the Top10 Marathon. This was a focused, 10-week effort to quickly test dozens of algorithmic ideas related to improving our Top10 row. Think of it as a 2-month hackathon with metrics. Different teams and individuals were invited to contribute ideas and code in this effort. We rolled out 6 different ideas as A/B tests each week and kept track of the offline and online metrics. The winning results are already part of our production system.
Conclusion
The Netflix Prize abstracted the recommendation problem to a proxy question of predicting ratings. But member ratings are only one of the many data sources we have and rating predictions are only part of our solution. Over time we have reformulated the recommendation problem to the question of optimizing the probability a member chooses to watch a title and enjoys it enough to come back to the service. More data availability enables better results. But in order to get those results, we need to have optimized approaches, appropriate metrics and rapid experimentation.To excel at innovating personalization, it is insufficient to be methodical in our research; the space to explore is virtually infinite. At Netflix, we love choosing and watching movies and TV shows. We focus our research by translating this passion into strong intuitions about fruitful directions to pursue; under-utilized data sources, better feature representations, more appropriate models and metrics, and missed opportunities to personalize. We use data mining and other experimental approaches to incrementally inform our intuition, and so prioritize investment of effort. As with any scientific pursuit, there’s always a contribution from Lady Luck, but as the adage goes, luck favors the prepared mind. Finally, above all, we look to our members as the final judges of the quality of our recommendation approach, because this is all ultimately about increasing our members' enjoyment in their own Netflix experience. We are always looking for more people to join our team of "prepared minds". Make sure you take a look at our jobs page.
Asgard: Web-based Cloud Management and Deployment
For the past several years Netflix developers have been using self-service tools to build and deploy hundreds of applications and services to the Amazon cloud. One of those tools is Asgard, a web interface for application deployments and cloud management.
- Asgard, the Grails App that Deploys Netflix to the Cloud (Slides 2012)
- Building Cloud Tools for Netflix (Slides 2011)
- Building Cloud Tools for Netflix (Video 2011)
Visual Language for the Cloud
Cloud Model
Application
Here’s a quick summary of the relationships of these cloud objects.
- An Auto Scaling Group (ASG) can attach zero or more Elastic Load Balancers (ELBs) to new instances.
- An ELB can send user traffic to instances.
- An ASG can launch and terminate instances.
- For each instance launch, an ASG uses a Launch Configuration.
- The Launch Configuration specifies which Amazon Machine Image (AMI) and which Security Groups to use when launching an instance.
- The AMI contains all the bits that will be on each instance, including the operating system, common infrastructure such as Apache and Tomcat, and a specific version of a specific Application.
- Security Groups can restrict the traffic sources and ports to the instances.
Cluster
The old ASG is “disabled” meaning it is not taking traffic but remains available in case a problem occurs with the new ASG. Traffic comes from ELBs and/or from Discovery, an internal Netflix service that is not yet open sourced.
Deployment Methods
Fast Rollback
The animation illustrates the following deployment use case:
- Create the new ASG obiwan-v064
- Enable traffic to obiwan-v064
- Disable traffic on obiwan-v063
- Monitor results and notice that things are going badly
- Re-enable traffic on obiwan-v063
- Disable traffic on obiwan-v064
- Analyze logs on bad servers to diagnose problems
- Delete obiwan-v064
Rolling Push
- If an ASG's instances are sharded so each instance has a distinct purpose that should not be duplicated by another instance.
- If the clustering mechanisms of the application (such as Cassandra) cannot support sudden increases in instance count for the cluster.
- Replacing instances in small batches can take a long time.
- Reversing a bad deployment can take a long time.
Task Automation
Auto Scaling
Why not the AWS Management Console?
Hide the Amazon keys
Netflix grants its employees a lot of freedom and responsibility, including the rights and duties of enhancing and repairing production systems. Most of those systems run in the Amazon cloud. Although we want to enable hundreds of engineers to manage their own cloud apps, we prefer not to give all of them the secret keys to access the company’s Amazon accounts directly. Providing an internal console allows us to grant Asgard users access to our Amazon accounts without telling too many employees the shared cloud passwords. This strategy also saves us from needing to assign and revoke hundreds of Identity and Access Management (IAM) cloud accounts for employees.
Auto Scaling Groups
As of this writing the AWS Management Console lacks support for Auto Scaling Groups (ASGs). Netflix relies on ASGs as the basic unit of deployment and management for instances of our applications. One of our goals in open sourcing Asgard is to help other Amazon customers make greater use of Amazon’s sophisticated auto scaling features. ASGs are a big part of the Netflix formula to provide reliability, redundancy, cost savings, clustering, discoverability, ease of deployment, and the ability to roll back a bad deployment quickly.
Enforce Conventions
Like any growing collection of things users are allowed to create, the cloud can easily become a confusing place full of expensive, unlabeled clutter. Part of the Netflix Cloud Architecture is the use of registered services associated with cloud objects by naming convention. Asgard enforces these naming conventions in order to keep the cloud a saner place that is possible to audit and clean up regularly as things get stale, messy, or forgotten.
Logging
So far the AWS console does not expose a log of recent user actions on an account. This makes it difficult to determine whom to call when a problem starts, and what recent changes might relate to the problem. Lack of logging is also a non-starter for any sensitive subsystems that legally require auditability.
Integrate Systems
Having our own console empowers us to decide when we want to add integration points with our other engineering systems such as Jenkins and our internal Discovery service.
Costs
Feature Films
Conclusion
Related Resources
Asgard
Netflix Cloud Platform
- Netflix Open Source Projects
- Auto Scaling in the Amazon Cloud
- Servo (Publish application metrics for auto scaling)
- Netflix Cloud Architecture Slides
- Netflix Operations: Part I, Going Distributed
- @NetflixOSS Twitter Feed
Amazon Web Services
Scalable Logging and Tracking
by Kedar Sadekar
Considerations
Data Size
Latency
Holding on to the request is expensive
Fail fast / first
HTTP codes
Dependencies can and will slow down sometimes
Process Later
Garbage Collection
Auto Scaling
Measure, Measure
Have Knobs
Conclusion
References
Join Us
Lessons Netflix Learned From The AWS Storm
Overview
On Friday, June 29th, we experienced one of the most significant outages in over a year. It started at about 8 PM Pacific Time and lasted for about three hours, affecting Netflix members in the Americas. We’ve written frequently about our resiliency efforts and our experience with the Amazon cloud. In the past, we’ve been able to withstand Amazon Web Services (AWS) availability zone outages with minimal impact. We wanted to take this opportunity to share our findings about why this particular zone outage had such an impact.
For background, you can read about Amazon’s root-cause analysis of their outage here: http://aws.amazon.com/message/67457/. The short version is that one of Amazon’s Availability Zones (AZs) failed on Friday evening due to a power outage that was caused by a severe storm. Power was restored 20 minutes later. However, the Elastic Load Balancing (ELB) service suffered from capacity problems and an API backlog, which slowed recovery.
Our own root-cause analysis uncovered some interesting findings, including an edge-case in our internal mid-tier load-balancing service. This caused unhealthy instances to fail to deregister from the load-balancer which black-holed a large amount of traffic into the unavailable zone. In addition, the network calls to the instances in the unavailable zone were hanging, rather than returning no route to host.
As part of this outage we have identified a number of things that both we and Amazon can do better, and we are working with them on improvements.
Middle-tier Load Balancing
In our middle tier load-balancing, we had a cascading failure that was caused by a feature we had implemented to account for other types of failures. The service that keeps track of the state of the world has a fail-safe mode where it will not remove unhealthy instances in the event that a significant portion appears to fail simultaneously. This was done to deal with network partition events and was intended to be a short-term freeze until someone could investigate the large-scale issue. Unfortunately, getting out of this state proved both cumbersome and time consuming, causing services to continue to try and use servers that were no longer alive due to the power outage
Gridlock
Clients trying to connect to servers that were no longer available led to a second-order issue. All of the client threads were taken up by attempted connections and there were very few threads that could process requests. This essentially caused gridlock inside most of our services as they tried to traverse our middle-tier. We are working to make our systems resilient to these kinds of edge cases. We continue to investigate why these connections were timing out during connect, rather than quickly determining that there was no route to the unavailable hosts and failing quickly.
Summary
Netflix made the decision to move from the data center to the cloud several years ago [1]. While it’s easy and common to blame the cloud for outages because it’s outside of our control, we found that our overall availability over the past several years has steadily improved. When we dig into the root-causes of our biggest outages, we find that we can typically put in resiliency patterns to mitigate service disruption.
There were aspects of our resiliency architecture that worked well:
- Regional isolation contained the problem to users being served out of the US-EAST region. Our European members were unaffected.
- Cassandra, our distributed cloud persistence store which is distributed across all zones and regions, dealt with the loss of one third of its regional nodes without any loss of data or availability.
- Chaos Gorilla, the Simian Army member tasked with simulating the loss of an availability zone, was built for exactly this purpose. This outage highlighted the need for additional tools and use cases for both Chaos Gorilla and other parts of the Simian Army.
We take our availability very seriously and strive to provide an uninterrupted service to all our members. We’re still bullish on the cloud and continue to work hard to insulate our members from service disruptions in our infrastructure.
We’re continuing to build up our Cloud Operations and Reliability Engineering team, which works on exactly the types of problems identified above, as well as each service team to deal with resiliency. Take a look at jobs.netflix.com for more details and apply directly or contact @atseitlin if you’re interested.
[1] http://techblog.netflix.com/2010/12/four-reasons-we-choose-amazons-cloud-as.html
Embracing the Differences : Inside the Netflix API Redesign
- Embrace the Differences of the Devices
- Separate Content Gathering from Content Formatting/Delivery
- Redefine the Border Between "Client" and "Server"
- Distribute Innovation
I will go into more detail below about each of these, including our implementation and what the benefits (and potential detriments) are of this approach. However, each philosophy reflects our top-level goal: to provide whatever is best for the Netflix customer. If we can improve the interaction between the API and our UIs, we have a better chance of making more of our customers happier.
Now, the philosophies…
Embrace the Differences of the Devices
The key driver for this redesigned API is the fact that there are a range of differences across the 800+ device types that we support. Most APIs (including the REST API that Netflix has been using since 2008) treat these devices the same, in a generic way, to make the server-side implementations more efficient. And there is good reason for this approach. Providing an OSFA API allows the API team to maintain a solid contract with a wide range of API consumers because the API team is setting the rules for everyone to follow.While effective, the problem with the OSFA approach is that its emphasis is to make it convenient for the API provider, not the API consumer. Accordingly, OSFA is ignoring the differences of these devices; the differences that allow us to more optimally take advantage of the rich features offered on each. To give you an idea of these differences, devices may differ on:
- Memory capacity or processing power, potentially modifying how much content it can manage at a given time
- Requirements for distinct markup formats and broader device proliferation increases the likelihood of this
- Document models, some devices may perform better with flatter models, others with more hierarchical
- Screen real estate which may impact the content elements that are needed
- Document delivery, some performing better with bits streamed across HTTP rather than delivered as a complete document
- User interactions, which could influence the metadata fields, delivery method, interaction model, etc.
Our new model is designed to cut against the OSFA paradigm and embrace the differences across devices while supporting those differences equally. To achieve this, our API development platform allows each UI team to create customized endpoints. So the request/response model can be optimized for each team’s UIs to account for unique or divergent device requirements. To support the variability in our request/response model, we need a different kind of architecture, which takes us to the next philosophy...
Separate Content Gathering from Content Formatting/Delivery
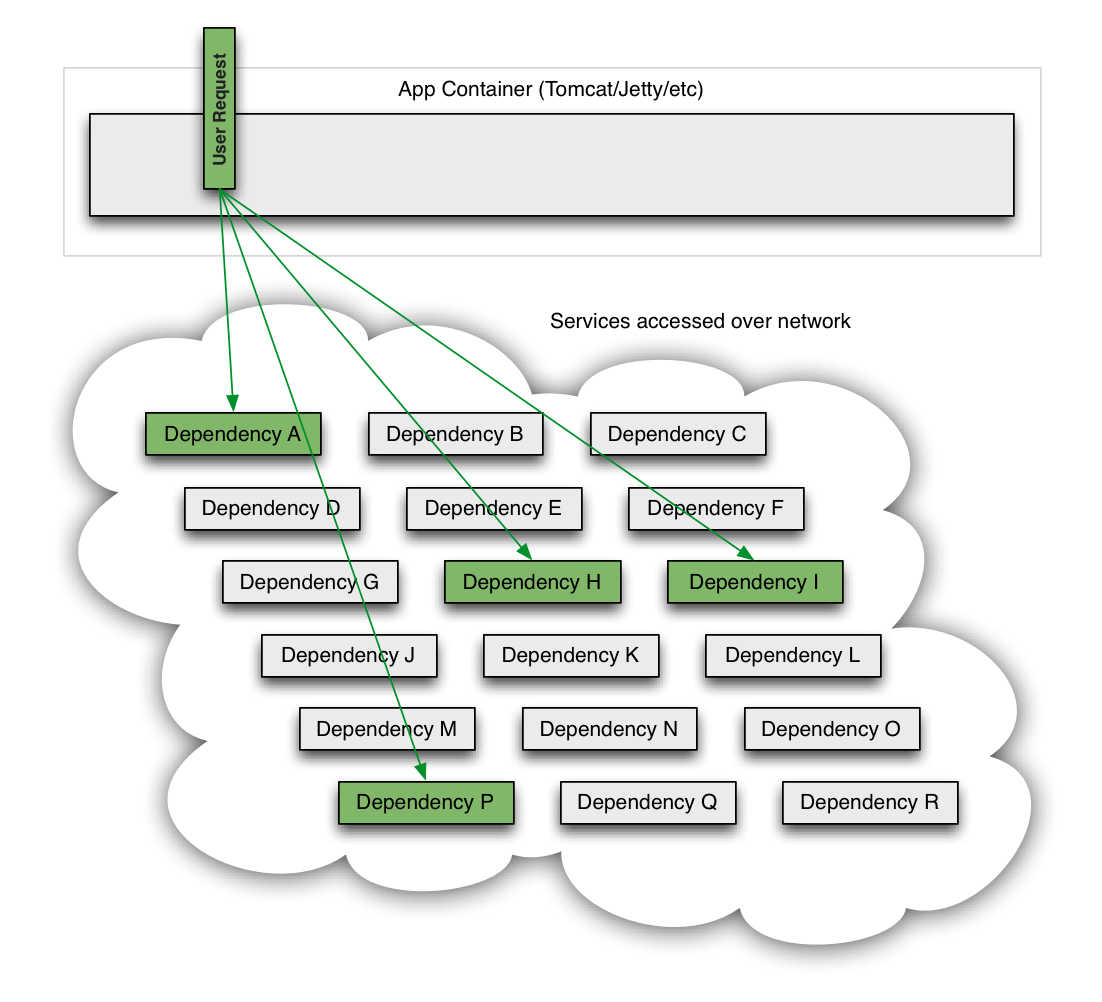
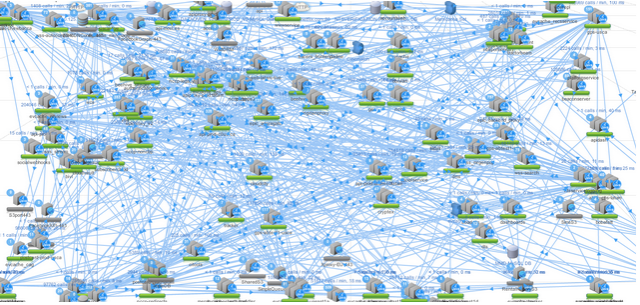
In many OSFA implementations, the API is the engine that retrieves the content from the source(s), prepares that payload, and then ultimately delivers it. Historically, this implementation is also how the Netflix REST API has operated, which is loosely represented by the following image.
The above diagram shows a rainbow of colors roughly representing some of the different requests needed for the PS3, as an example, to start the Netflix experience. Other UIs will have a similar set of interactions against the OSFA REST API given that they are all required by the API to adhere to roughly the same set of rules. Inside the REST API is the engine that performs the gathering, preparation and delivery of the content (indifferent to which UI made the request).
Our new API has departed from the OSFA API model towards one that enables fine-grained customizations without compromising overall system manageability. To achieve this model, our new architecture clearly separates the operations of content gathering from content formatting and delivery. The following diagram represents this modified architecture:

In this new model, the UIs make a single request to a custom endpoint that is designed to specifically handle that request. Behind the endpoint is a handler that parses the request and calls the Java API, which gathers the content by calling back to a range of dependent services. We will discuss in later posts how we do this, particularly in how we parse the requests, trigger calls to dependencies, handle concurrency, support fallbacks, as well as other techniques we use to ensure optimized and accurate gathering of the content. For now, though, I will just say that the content gathering from the Java API is generic and independent of destination, just like the OSFA approach.
After the content has been gathered, however, it is handed off to the formatting and delivery engines which sit on top of the Java API on the server. The diagram represents this layer by showing an array of different devices resting on top of the Java API, each of which corresponds to the custom endpoints for a given UI and/or set of devices. The custom endpoints, as mentioned earlier, support optimized request/response handling for that device, which takes us to the next philosophy...
Redefine the Border Between "Client" and "Server"
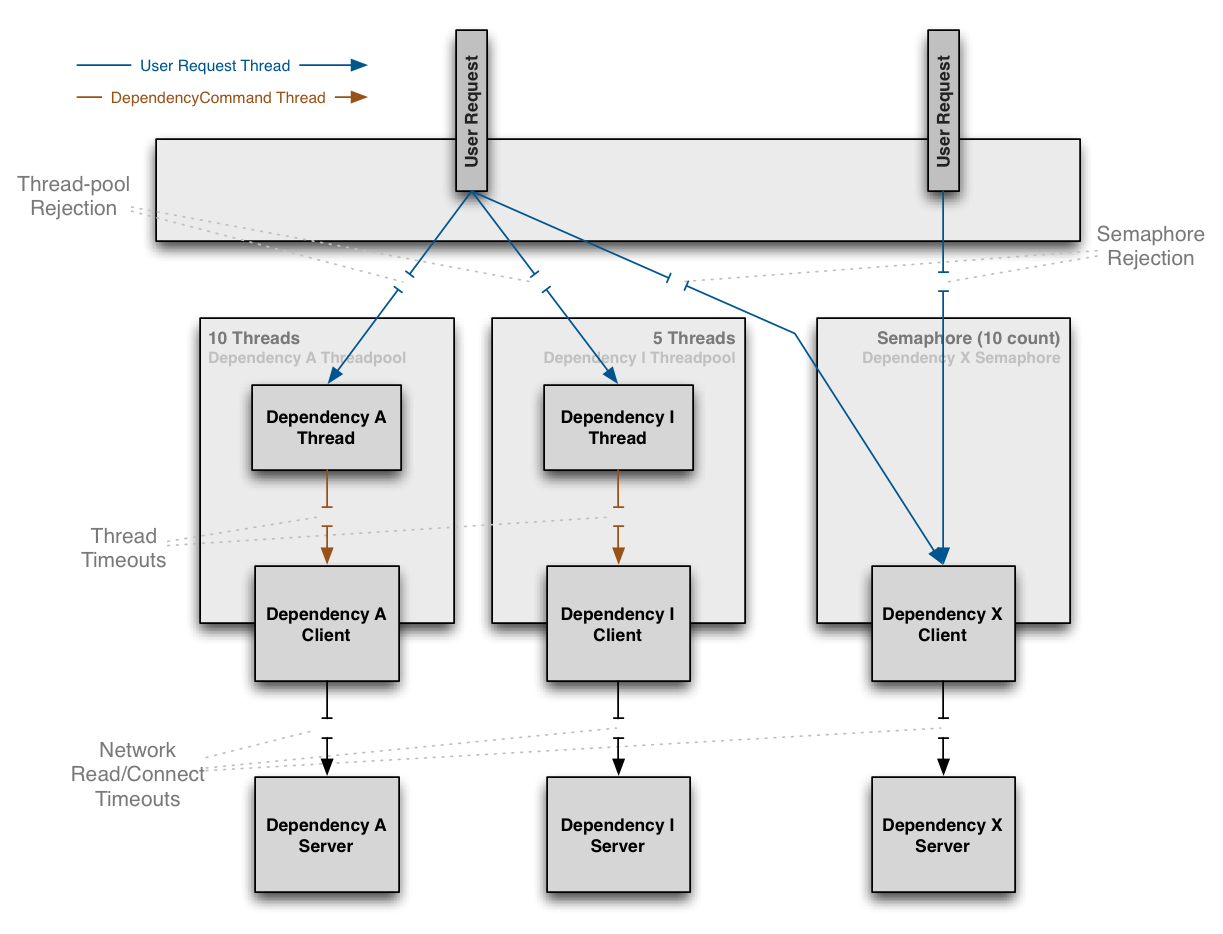
The traditional definition of "client code" is all code that lives on a given device or UI. "Server code" is typically defined as the code that resides on the server. The divide between the two is the network border. This is often the case for REST APIs and that border is where the contract between the API provider and API consumer is engaged, as was the case for Netflix’s REST API, as shown below:
In our new approach, we are pushing this border back to the server, and with it goes a substantial portion of the UI-specific content processing. All of the code on the device is still considered client code, but some client code now resides on the server. In essence, the client code on the device makes a network call back to a dedicated client adapter that resides on the server behind the custom endpoint. Once back on the server, the adapter (currently written in Groovy) explodes that request out to a series of server-side calls that get the corresponding content (in some cases, roughly the same rainbow of requests that would be handled across HTTP in our old REST API). At that point, the Java APIs perform their content gathering functions and deliver the requested content back to the adapter. Once the adapter has some or all of its content, the adapter processes it for delivery, which includes pruning out unwanted fields, error handling and retries, formatting the response, and delivering the document header and body. All of this processing is custom to the specific UI. This new definition of client/server is represented in the following diagram:

There are two major aspects to this change. First, it allows for more efficient interactions between the device and the server since most calls that otherwise would be going across the network can be handled on the server. Of course, network calls are the most expensive part of the transaction, so reducing the number of network requests improves performance, in some cases by several seconds. The second key component leads us to the final (and perhaps most important) philosophy to this approach, which is the distribution of the work for building out the optimized adapters.
Distribute Innovation
One expected critique with this approach is that as we add more devices and build more UIs for A/B and multivariate tests, there will undoubtedly be myriad adapters needed to support all of these distinct request profiles. How can we innovate rapidly and support such a diverse (and growing) set of interactions? It is critical for us to support the custom adapters, but it is equally important for us to maintain a high rate of innovation across these UIs and devices.- A device, such as the PS3, makes a single request across the network to load the home screen (This code is written and supported by the PS3 UI team)
- A Groovy adapter receives and parses the PS3 request (PS3 UI team)
- The adapter explodes that one request into many requests that call the Java API to (PS3 UI team)
- Each Java API calls back to a dependent service, concurrently when appropriate, to gather the content needed for that sub-request (API team)
- In the Java API, if a dependent service unavailable or returns a 4xx or 5xx, the Java API returns a fallback and/or an error code to the adapter (API team)
- Successful Java API transactions then return the content back to the adapter when each thread has completed (API team)
- The adapter can handle the responses from each thread progressively or all together, depending on how the UI team wants to handle it (PS3 UI team)
- The adapter then manipulates the content, retrieves the wanted (and prunes out the unwanted) elements, handle errors, etc. (PS3 UI team)
- The adapter formats the response in preparation for delivery back across the network to the PS3, which includes everything needed for the PS3 home screen in the single payload (PS3 UI team)
- The adapter finally handles the delivery of the payload across the network (PS3 UI team)
- The device will then parse this optimized response and populate the UI (PS3 UI team)
As described above, pushing some of the client code back to the servers and providing custom endpoints gives us the opportunity to distribute the API development to the UI teams. We are able to do this because the consumers of this private API are the Netflix UI and device teams. Given that the UI teams can create and modify their own adapter code (potentially without any intervention or involvement from the API team), they can be much more nimble in their development. In other words, as long as the content is available in the Java API, the UI teams can change the code that lives on the device to support the user experience and at the same time change the adapter code to deliver the payload needed for that experience. They are no longer bound by server teams dictating the rules and/or being a bottleneck for their development. API innovation is now in the hands of the UI teams! Moreover, because these adapters are isolated from each other, this approach also diminishes the risk of harming other device implementations with tactical changes in their device-specific APIs.
Of course, one drawback to this is that UI teams are often more skilled in technologies like HTML5, CSS3, JavaScript, etc. In this system, they now need to learn server-side technologies and techniques. So far, however, this has been a relatively small issue, especially since our engineering culture is to hire very strong, senior-level engineers who are adaptable, curious and passionate about learning and implementing these kinds of solutions. Another concern is that because the UI teams are implementing server-side adapters, they have the potential to bring down the servers through infinite loops or other processes that are resource intensive. To offset this, we are working on scrubbing engines that will hopefully minimize the likelihood of such mistakes. That said, in the OSFA world, code on the device can just as easily DDOS the server, it is just potentially a bigger problem if it runs on the server.
We are still in the early stages of this new system. Some of our devices have fully migrated over to it, others are split between it and the REST API, and others are just getting their feet wet. In upcoming posts, we will share more about the deeper technical aspects of the system, including the way we handle concurrency, how we manage the adapters, the interaction between the adapters and the Java API, our Groovy implementation, error handling, etc. We will also continue to share the evolution of this system as we learn more about it.
In the meantime, if you are interested in building high-scale, cloud-based solutions such as this one, we are hiring!
Daniel Jacobson (@daniel_jacobson)
Director of Engineering – Netflix API
Open Source at Netflix
- We have benefited from many other people contributing to open source, so we are paying back in kind.
- Netflix was an early cloud adopter, moving all of our streaming services to run on top of AWS infrastructure. We paid the pioneer tax – by encountering and working through many issues, corner cases and limitations. We’ve captured the patterns that work in our platform components and automation tools. We benefit from the scale effects of other AWS users adopting similar patterns, and will continue working with the community to develop the ecosystem.
- External community contributions - by opening up we enable the larger developer community to: review, comment, add test cases, bug fixes, ports and functional contributions to our components, benefiting everyone.
- Improved code and documentation quality – we’ve observed that the peer pressure from “Social Coding” has driven engineers to make sure code is clean and well structured, documentation is useful and up to date. What we’ve learned is that a component may be “Good enough for running in production, but not good enough for Github”.
- Durability – we think any code will fare better over time if it’s actively developed by an open community and used widely vs. maintained by small number of engineers for a single workload.
- Curator - Client wrapper and rich Zookeeper framework.
- Exhibitor - Co-process for instance monitoring, backup/recovery, cleanup and visualization.
- Astyanax - High level, simple object oriented client for Cassandra.
- Priam - Co-process for backup/recovery, Token Management and centralized Configuration management for Cassandra.
- Jmeter Plugin for Cassandra - automation for running Cassandra tests.
- Autoscaling scripts - Tools and documentation about using Auto Scaling part of AWS services.
- Archaius - library for managing dynamic configuration properties.
- Asgard - Web interface for application deployment and cloud management in AWS.