Quantcast
Channel: Netflix TechBlog - Medium
Viewing all 303 articles
Browse latest View live

What's trending on Netflix?

$
0
0


Every day, millions of members across the globe, from thousands of devices, visit Netflix and generate millions of viewing hours. The majority of these viewing hours are generated through the videos that are recommended by our recommender systems. We continue to invest in improving our recommender systems that aid our members to discover and watch the specific content they love. We are constantly trying to improve the quality of the recommendations using the sound foundation of AB testing.


On that front, we recently AB tested introducing a new row of videos on the home screen called “Trending Now”, which shows the videos that are trending in Netflix infused with some personalization for our members. This post explains how we built the backend infrastructure that powers the Trending Now row.


Traditionally, we pre-compute many of the recommendations for our members based on a combination of explicit signals (viewing history, ratings, My List, etc.) and other implicit signals (scroll activity, navigation, etc.) within Netflix, in near-line fashion. However, the Trending Now row is computed as events happen in real time. This allows us to not only personalize this row based on the context like time of day and day of week, but also react to sudden changes in collective interests of members, due to a real-world events such as Oscars or Halloween.


Data Collection


There are primarily two data streams that are used to determine the trending videos:
  • Play events: Videos that are played by our member
  • Impression events: Videos seen by our members in their view port

Netflix embraces Service Oriented Architecture (SOA) composed of many small fine grained services that do one thing and one thing well. In that vein, Viewing History Service captures all the videos that are played by our members. Beacon is another service that captures all impression events and user activities within Netflix. The requirement of computing recommendations in real time, presents us with an exciting challenge to make our data collection/processing pipeline a low latency, highly scalable and resilient system. We chose Kafka, a distributed messaging system, for our data pipeline as it has proven to handle millions of events per second. All the data collected by the Viewing History and Beacon services are sent to Kafka.

Data Processing


We built a custom stream processor that consumes the play and impressions events from Kafka and computes the following aggregated data:
  • Play popularity: How many times is a video played
  • Take rate: Fraction of play events over impression events for a given video

The first step in the data processing layer is to join the play and impression streams. We join them by request id, which is a unique identifier used to tie the front end calls to the backend service calls. With this join, all the plays and impressions events are grouped together for a given request id as illustrated in the figure below.


This joined stream is then partitioned by video id, for all the plays and impression events of a given video to be processed at the same consumer instance. This way, each consumer will be able to atomically calculate the total number of plays and impressions data for every video. The aggregated play popularity and take rate data are persisted into Cassandra, as shown in the figure below.


Real Time Data Monitoring


Given the importance of the data quality to the recommendation system and the user experience, we continuously do canary analysis for the event streams. This involves simple validations such as the presence of mandatory attributes within an event to more complex validations such as finding the absence of an event within a time window. With appropriate alerting in place, within minutes of every UI push, we are able to catch any data regressions with this real time stream monitoring.


It is imperative that the Kafka consumers are able to keep up with the incoming load into Kafka. Processing an event that was minutes old will neither provide a real trending effect nor help find data regression issues soon.


Bringing it all together


On a live user request, the aggregated play popularity and take rate data along with other explicit signals such as members’ viewing history and past ratings are used to compute a personalized Trending now row. The following figure shows the end to end infrastructure for building Trending Now row.


Netflix has a data-driven culture that is key to our success.  With billions of member viewing events and tens of millions of categorical preferences, we have endless opportunities to improve our recommendations even further.


We are in the midst of replacing our custom stream processor with Spark Streaming. Stay tuned for an upcoming tech blog on our resiliency testing on Spark Streaming.

If you would like to join us in tackling these kinds of challenges, we arehiring!

A Microscope on Microservices

$
0
0

by Coburn Watson, Scott Emmons, and Brendan Gregg


At Netflix we pioneer new cloud architectures and technologies to operate at massive scale - a scale which breaks most monitoring and analysis tools. The challenge is not just handling a massive instance count but to also provide quick, actionable insight for a large-scale, microservice-based architecture. Out of necessity we've developed our own tools for performance and reliability analysis, which we've also been open-sourcing (e.g., Atlas for cloud-wide monitoring). In this post we’ll discuss tools that the Cloud Performance and Reliability team have been developing, which are used together like a microscope switching between different magnifications as needed.

Request Flow (10X Magnification)

We'll start at a wide scale, visualizing the relationship between microservices to see which are called and how much time is spent in each:


Using an in-house dapper-like framework, we are able to layer the request demand through the aggregate infrastructure onto a simple visualization. This internal utility, Slalom, allows a given service to understand upstream and downstream dependencies, their contribution on service demand, and the general health of said requests. Data is initially represented through d3-based Sankey diagrams, with a detailed breakdown on absolute service demand and response status codes.
This high-level overview gives a general picture of all the distributed services that are composed to satisfy a request. The height of each service node shows the amount of demand on that service, with the outgoing links showing demand on a downstream service relative to its siblings.

Double-clicking a single service exposes the bi-directional demand over the time window:

The macro visualization afforded by Slalom is limited based on the data available in the underlying metrics that are sampled. To bring into focus additional metric dimensions beyond simple IPC interactions we built another tool, Mogul.

Show me my bottleneck! (100X)

The ability to decompose where time is spent both within and across the fleet of microservices can be a challenge given the number of dependencies.  Such information can be leveraged to identify the root cause of performance degradation or identify areas ripe for optimization within a given microservice.  Our Mogul utility consumes data from Netflix’s recently open-sourced Atlas monitoring framework, applies correlation between metrics, and selects those most likely to be responsible for changes in demand on a given microservice. The different resources evaluated include:
  • System resource demand (CPU, network, disk)
  • JVM pressure (thread contention, garbage collection)
  • Service IPC calls
  • Persistency-related calls (EVCache, Cassandra)
  • Errors and timeouts
It is not uncommon for a mogul query to pull thousands of metrics, subsequently reducing to tens of metrics through correlation with system demand. In the following example, we were able to quickly identify which downstream service was causing performance issues for the service under study. This particular microservice has over 40,000 metrics. Mogul reduced this internally to just over 2000 metrics via pattern matching, then correlated the top 4-6 interesting metrics grouped into classifications.

The following diagram displays a perturbation in the microservice response time (blue line) as it moves from ~125 to over 300 milliseconds.  The underlying graphs identifies those downstream calls that have a time-correlated increase in system demand.


Like Slalom, Mogul uses Little’s Law - the product of response time and throughput - to compute service demand.

My instance is bad ... or is it? (1000X)

Those running on the cloud or virtualized environments are not unfamiliar with the phrase “my instance is bad.” To evaluate if a given host is unstable or under pressure it is important to have the right metrics available on-demand and at a high resolution (5 seconds or less).  Enter Vector, our on-instance performance monitoring framework which exposes hand-picked, high-resolution system metrics to every engineer’s browser.  Leveraging the battle tested system monitoring framework Performance Co-Pilot (pcp) we are able to layer on a UI that polls instance-level metrics between every 1 and 5 seconds.  


This resolution of system data exposes possible multi-modal performance behavior not visible with higher-level aggregations.  Many times a runaway thread has been identified as a root cause of performance issues while overall CPU utilization remains low.  Vector abstracts away the complexity typically required with logging onto a system and running a large number of commands from the shell.

A key feature of Vector and pcp is extensibility.  We have created multiple custom pcp agents to expose additional key performance views.  One example is a flamegraph generated by sampling the on-host Java process using jstack.  This view allows an engineer to quickly drill on where the Java process is spending CPU time.

Next Steps..To Infinity and Beyond

The above tools have proved invaluable in the domain of performance and reliability analysis at Netflix, and  we are looking to open source Vector in the coming months. In the meantime we continue to extend our toolset by improving instrumentation capabilities at a base level. One example is a patch on OpenJDK which allows the generation of extended stack trace data that can be used to visualize system-through-user space time in the process stack.

Conclusion

It quickly became apparent at Netflix’s scale that viewing the performance of the aggregate system through a single lens would be insufficient.  Many commercial tools promise a one-stop shop but have rarely scaled to meet our needs.  Working from a macro-to-micro view, our team developed tools based upon the use cases we most frequently analyze and triage.  The result is much like a microscope which lets engineering teams select the focal length that most directly targets their dimension of interest.

As one engineer on our team puts it, “Most current performance tool methodologies are so 1990’s.” Finding and dealing with future observability challenges is key to our charter, and we have the team and drive to accomplish it.  If you would like to join us in tackling this kind of work, we are hiring!

Netflix Releases Falcor Developer Preview

$
0
0
by Jafar Husain, Paul Taylor and Michael Paulson

Developers strive to create the illusion that all of their application’s data is sitting right there on the user’s device just waiting to be displayed. To make that experience a reality, data must be efficiently retrieved from the network and intelligently cached on the client.

That’s why Netflix created Falcor, a JavaScript library for efficient data fetching. Falcor powers Netflix’s mobile, desktop and TV applications.

Falcor lets you represent all your remote data sources as a single domain model via JSON Graph. Falcor makes it easy to access as much or as little of your model as you want, when you want it. You retrieve your data using familiar JavaScript operations like get, set, and call. If you know your data, you know your API.

You code the same way no matter where the data is, whether in memory on the client or over the network on the server. Falcor keeps your data in a single, coherent cache and manages stale data and cache pruning for you. Falcor automatically traverses references in your graph and makes requests as needed. It transparently handles all network communications, opportunistically batching and de-duping requests.

Today, Netflix is unveiling a developer preview of Falcor:

Falcor is still under active development and we’ll be unveiling a roadmap soon. This developer preview includes a Node version of our Falcor Router not yet in production use.

We’re excited to start developing in the open and share this library with the community, and eager for your feedback and contributions.

For ongoing updates, follow Falcor on Twitter!

Fenzo: OSS Scheduler for Apache Mesos Frameworks

$
0
0
Bringing Netflix to our millions of subscribers is no easy task. The product comprises dozens of services in our distributed environment, each of which is operating a critical component to the experience while constantly evolving with new functionality. Optimizing the launch of these services is essential for both the stability of the customer experience as well as overall performance and costs. To that end, we are happy to introduce Fenzo, an open source scheduler for Apache Mesos frameworks. Fenzo tightly manages the scheduling and resource assignments of these deployments.


Fenzo is now available in the Netflix OSS suite. Read on for more details about how Fenzo works and why we built it. For the impatient, you can find source code and docs on Github.

Why Fenzo?

Two main motivations for developing a new framework, as opposed to leveraging one of the many frameworks in the community, were to achieve scheduling optimizations and to be able to autoscale the cluster based on usage, both of which will be discussed in greater detail below. Fenzo enables frameworks to better manage ephemerality aspects that are unique to the cloud. Our use cases include a reactive stream processing system for real time operational insights and managing deployments of container based applications.


At Netflix, we see a large variation in the amount of data that our jobs process over the course of a day. Provisioning the cluster for peak usage, as is typical in data center environments, is wasteful. Also, systems may occasionally be inundated with interactive jobs from users responding to certain anomalous operational events. We need to take advantage of the cloud’s elasticity and scale the cluster up and down based on dynamic loads.


Although scaling up a cluster may seem relatively easy by watching, for example, the amount of available resources falling below a threshold, scaling down presents additional challenges. If the tasks are long lived and cannot be terminated without negative consequences, such as time consuming reconfiguration of stateful stream processing topologies, the scheduler will have to assign them such that all tasks on a host terminate at about the same time so the host can be terminated for scale down.

Scheduling Strategy

Scheduling tasks requires optimization of resource assignments to maximize the intended goals. When there are multiple resource assignments possible, picking one versus another can lead to significantly different outcomes in terms of scalability, performance, etc. As such, efficient assignment selection is a crucial aspect of a scheduler library. For example, picking assignments by evaluating every pending task with every available resource is computationally prohibitive.

Scheduling Model

Our design focused on large scale deployments with a heterogeneous mix of tasks and resources that have multiple constraints and optimizations needs. If evaluating the most optimal assignments takes a long time, it could create two problems:
  • resources become idle, waiting for new assignments
  • task launches experience increased latency


Fenzo adopts an approach that moves us quickly in the right direction as opposed to coming up with the most optimal set of scheduling assignments every time.


Conceptually, we think of tasks as having an urgency factor that determines how soon it needs an assignment, and a fitness factor that determines how well it fits on a given host.
If the task is very urgent or if it fits very well on a given resource, we go ahead and assign that resource to the task. Otherwise, we keep the task pending until either urgency increases or we find another host with a larger fitness value.

Trading Off Scheduling Speed with Optimizations

Fenzo has knobs for you to choose speed and optimal assignments dynamically. Fenzo employs a strategy of evaluating optimal assignments across multiple hosts, but, only until a fitness value deemed “good enough” is obtained. While a user defined threshold for fitness being good enough controls the speed, a fitness evaluation plugin represents the optimality of assignments and the high level scheduling objectives for the cluster. A fitness calculator can be composed from multiple other fitness calculators, representing a multi-faceted objective.

Task Constraints

Fenzo tasks can use optional soft or hard constraints to influence assignments to achieve locality with other tasks and/or affinity to resources. Soft constraints are satisfied on a best efforts basis and combine with the fitness calculator for scoring hosts for possible assignment. Hard constraints must be satisfied and act as a resource selection filter.

Fenzo provides all relevant cluster state information to the fitness calculators and constraints plugins so you can optimize assignments based on various aspects of jobs, resources, and time.

Bin Packing and Constraints Plugins

Fenzo currently has built-in fitness calculators for bin packing based on CPU, memory, or network bandwidth resources, or a combination of them.


Some of the built-in constraints address common use cases of locality with respect to resource types, assigning distinct hosts to a set of tasks, balancing tasks across a given host attribute, such as the availability zone, rack location, etc.


You can customize fitness calculators and constraints by providing new plugins.

Cluster Autoscaling

Fenzo supports cluster autoscaling using two complementary strategies:
  • Thresholds based
  • Resource shortfall analysis based


Thresholds based autoscaling lets users specify rules per host group (e.g., EC2 Auto Scaling Group, ASG) being used in the cluster. For example, there may be one ASG created for compute intensive workloads using one EC2 instance type, and another for network intensive workloads. Each rule helps maintain a configured number of idle hosts available for launching new jobs quickly.


The resource shortfall analysis attempts to estimate the number of hosts required to satisfy the pending workload. This complements the rules based scale up during demand surges. Fenzo’s autoscaling also complements predictive autoscaling systems, such as Netflix’s Scryer.

Usage at Netflix

Fenzo is currently being used in two Mesos frameworks at Netflix for a variety of use cases including long running services and batch jobs. We have observed that the scheduler is fast at allocating resources with multiple constraints and custom fitness calculators. Also, Fenzo has allowed us to scale the cluster based on current demand instead of provisioning it for peak demand.


The table below shows the average and maximum times we have observed for each scheduling run in one of our clusters. Each scheduling run may attempt to assign resources to more than one task. The run time can vary depending on the number of tasks that need assignments, the number and types of constraints used by the tasks, and the number of hosts to choose resources from.


Scheduler run time in milliseconds
Average
2 mS
Maximum
38 mS
(occasional spikes of about 30 mS)


The image below shows the number of Mesos slaves in the cluster going up and down as a result of Fenzo’s autoscaler actions over several days, representing about 3X difference in the maximum and minimum counts.
TitanAutoscaling2.png.

Fenzo Usage in Mesos Frameworks

FenzoUsageDiagram.png
A simplified diagram above shows how Fenzo is used by an Apache Mesos framework. Fenzo’s task scheduler provides the scheduling core without interaction with Mesos itself. The framework, interfaces with Mesos to get callbacks on new resource offers and task status updates. As well, it calls Mesos driver to launch tasks based on Fenzo’s assignments.

Summary

Fenzo has been a great addition to our cloud platform. It gives us a high degree of control over work scheduling on Mesos, and has enabled us to strike a balance between machine efficiency and getting jobs running quickly. Out of the box Fenzo supports cluster autoscaling and bin packing. Custom schedulers can be implemented by writing your own plugins.


Source code is available on Netflix Github. The repository contains a sample framework that shows how to use Fenzo. Also, the JUnit tests show examples of various features including writing custom fitness calculators and constraints. Fenzo wiki contains detailed documentation on getting you started.

From Chaos to Control - Testing the resiliency of Netflix’s Content Discovery Platform

$
0
0
By:Leena Janardanan, Bruce Wobbe, Vilas Veeraraghavan

Introduction
Merchandising Application Platform (MAP) was conceived as a middle-tier service that would handle real time requests for content discovery. MAP does this by aggregating data from disparate data sources and implementing common business logic into one distinct layer. This centralized layer helps provide common experiences across device platforms and helps reduce duplicate, and sometimes, inconsistent business logic. In addition, it also allows recommendation systems - which are typically pre-compute systems - to be de-coupled from the real time path. MAP can be compared to a big funnel through which most of the content discovery data on a user’s screen goes through and is processed.
As an example, MAP generates localized row names for the personalized recommendations on the home page. This happens in real time, based on the locale of the user at the time the request is made. Similarly, application of maturity filters, localizing and sorting categories are examples of logic that lives in MAP.


Localized categories and row names, up-to-date My List and Continue Watching


A classic example of duplicated but inconsistent business logic that MAP consolidated was the “next episode” logic -  the rule to determine if a particular episode was completed and the next episode should be shown. In one platform, it required that credits had started and/or 95% of the episode to be finished. In another platform, it was simply that 90% of the episode had to be finished. MAP consolidated this logic into one simple call that all devices now use.
 MAP also enables discovery data to be a mix of pre-computed and real time data. On the homepage, rows like My List, Continue Watching and Trending Now are examples of real time data whereas rows like “Because you watched” are pre-computed. As an example, if a user added a title to My List on a mobile device and decided to watch the title on a Smart TV, the user would expect My List on the TV to be up-to-date immediately. What this requires is the ability to selectively update some data in real time. MAP provides the APIs and logic to detect if data has changed and update it as needed. This allows us to keep the efficiencies gained from pre-compute systems for most of the data, while also having the flexibility to keep other data fresh.
MAP also supports business logic required for various A/B tests, many of which are active on Netflix at any given time. Examples include: inserting non-personalized  rows, changing the sort order for titles within a row and changing the contents of a row.
The services that generate this data are a mix of pre-compute and real time systems. Depending on the data, the calling patterns from devices for each type of data also vary. Some data is fetched once per session, some of it is pre-fetched when the user navigates the page/screen and other data is refreshed constantly (My List, Recently Watched, Trending Now).

Architecture

MAP is comprised of two parts - a server and a client. The server is the workhorse which does all the data aggregation and applies business logic. This data is then stored in caches (see EVCache) the client reads. The client primarily serves the data and is the home for resiliency logic. The client decides when a call to the server is taking too long, when to open a circuit (see Hystrix) and, if needed, what type of fallback should be served.


MAP is in the critical path of content discovery. Without a well thought out resiliency story, any failures in MAP would severely impact the user experience and Netflix's availability. As a result, we spend a lot of time thinking about how to make MAP resilient.

Challenges in making MAP resilient
Two approaches commonly used by MAP to improve resiliency are:
(1) Implementing fallback responses for failure scenarios
(2) Load shedding - either by opening circuits to the downstream services or by limiting retries wherever possible.

There are a number of factors that make it challenging to make MAP resilient: 
(1) MAP has numerous dependencies, which translates to multiple points of failure. In addition, the behavior of these dependencies evolves over time, especially as A/B tests are launched, and a solution that works today may not do so in 6 months. At some level, this is a game of Whack-A-Mole as we try to keep up with a constantly changing eco system.

(2) There is no one type of fallback that works for all scenarios:
    • In some cases, an empty response is the only option and devices have to be able to handle that gracefully. E.g. data for the "My List" row couldn't be retrieved.
    • Various degraded modes of performance can be supported. E.g. if the latest personalized home page cannot be delivered, fallbacks can range from stale, personalized recommendations to non-personalized recommendations.
    • In other cases, an exception/error code might be the right response, indicating to clients there is a problem and giving them the ability to adapt the user experience - skip a step in a workflow, request different data, etc.

How do we go from Chaos to Control?

Early on, failures in MAP or its dependent services caused SPS dips like this:


It was clear that we needed to make MAP more resilient. The first question to answer was - what does resiliency mean for MAP? It came down to these expectations:
(1) Ensure an acceptable user experience during a MAP failure, e.g. that the user can browse our selection and continue to play videos
(2) Services that depend on MAP i.e. the API service and device platforms are not impacted by a MAP failure and continue to provide uninterrupted services
(3) Services that MAP depends on are not overwhelmed by excessive load from MAP

It is easy enough to identify obvious points of failure. For example - if a service provides data X, we could ensure that MAP has a fallback for data X being unavailable. What is harder is knowing the impact of failures in multiple services - different combinations of them - and the impact of higher latencies.

This is where the Latency Monkey and FIT come in. Running Latency Monkey in our production environment allows us to detect problems caused by latent services. With Latency Monkey testing, we have been able to fix incorrect behaviors and fine tune various parameters on the backend services like:
(1) Timeouts for various calls
(2) Thresholds for opening circuits via Hystrix
(3) Fallbacks for certain use cases
(4) Thread pool settings

FIT, on the other hand, allows us to simulate specific failures. We restrict the scope of failures to a few test accounts. This allows us to validate fallbacks as well as the user experience. Using FIT, we are able to sever connections with:
(1) Cache that handles MAP reads and writes 
(2) Dependencies that MAP interfaces with
(3) MAP service itself


What does control look like?


In a successful run of FIT or Chaos Monkey, this is how metrics look like now:
Total requests served by MAP before and during the test(no impact)

MAP successful fallbacks during the test(high fallback rate)


On a lighter note, our failure simulations uncovered some interesting user experience issues, which have since been fixed.

  1. Simulating failures in all the dependent services of MAP server caused an odd data mismatch to happen:
The Avengers shows graphic for Peaky Blinders


  1. Severing connections to MAP server and the cache caused these duplicate titles to be served:


  1. When the cache was made unavailable mid session, some rows looked like this:


  1. Simulating a failure in the “My List” service caused the PS4 UI to be stuck on adding a title to My List:


In an ever evolving ecosystem of many dependent services, the future of resiliency testing resides in automation. We have taken small but significant steps this year towards making some of these FIT tests automated. The goal is to build these tests out so they run during every release and catch any regressions.


Looking ahead for MAP, there are many more problems to solve. How can we make MAP more performant? Will our caching strategy scale to the next X million customers? How do we enable faster innovation without impacting reliability? Stay tuned for updates!

Announcing Sleepy Puppy - Cross-Site Scripting Payload Management for Web Application Security Testing

$
0
0
by: Scott Behrens and Patrick Kelley

Netflix is pleased to announce the open source release of our cross-site scripting (XSS) payload management framework: Sleepy Puppy!

The Challenge of Cross-Site Scripting

Cross-site scripting is a type of web application security vulnerability that allows an attacker to execute arbitrary client-side script in a victim’s browser. XSS has been listed on the OWASP Top 10 vulnerability list since 2004, and developers continue to struggle with mitigating controls to prevent XSS (e.g. content security policy, input validation, output encoding). According to a recent report from WhiteHat Security, a web application is 47% likely to have one or more cross-site scripting vulnerabilities. 

A number of tools are available to identify cross-site scripting issues; however, security engineers are still challenged to fully cover the scope of applications in their portfolio. Automated scans and other security controls provide a base level of coverage, but often only focus on the target application. 


Delayed XSS Testing

Delayed XSS testing is a variant of stored XSS testing that can be used to extend the scope of coverage beyond the immediate application being tested. With delayed XSS testing, security engineers inject an XSS payload on one application that may get reflected back in a separate application with a different origin. Let’s examine the following diagram.


Here we see a security engineer inject an XSS payload into the assessment target (App #1 Server) that does not result in an XSS vulnerability. However, that payload was stored in a database (DB) and reflected back in a second application not accessible to the tester. Even though the tester can’t access the vulnerable application, the vulnerability could still be used to take advantage of the user. In fact, these types of vulnerabilities can be even more dangerous than standard XSS since the potential victims are likely to be privileged types of users (employees, administrators, etc.) 

To discover the triggering of a delayed XSS attack, the payload must alert the tester of App #2’s vulnerability in a different manner. 


Toward Better Delayed XSS Payload Management

A number of talks and tools cover XSS testing, with some focussing on the delayed variant. Tools like BEef, PortSwigger BurpSuite Collaborator, and XSS.IO are appropriate for a number of situations and can be beneficial tools in the application security engineer’s portfolio. However, we wanted a more comprehensive XSS testing framework to simplify XSS propagation and identification and allow us to work with developers to remediate issues faster. 

Without further ado, meet Sleepy Puppy! 


Sleepy Puppy

Sleepy Puppy is a XSS payload management framework that enables security engineers to simplify the process of capturing, managing, and tracking XSS propagation over long periods of time and numerous assessments.

We will use the following terminology throughout the rest of the discussion:

  • Assessments describe specific testing sessions and allow the user to optionally receive email notifications when XSS issues are identified for those assessments.
  • Payloads are XSS strings to be executed and can include the full range of XSS injection.
  • PuppyScripts are typically written in JavaScript and provide a way to collect information on where the payload executed. 
  • Captures are the screenshots and metadata collected by the default PuppyScript
  • Generic Collector is an endpoint that allows you to optionally log additional data outside the scope of a traditional capture. 

Sleepy Puppy is highly configurable, and you can create your own payloads and PuppyScripts as needed.

Security engineers can leverage the Sleepy Puppy assessment model to categorize payloads and subscribe to email notifications when delayed cross-site scripting events are triggered.

Sleepy Puppy also exposes an API for users who may want to develop plugins for scanners such as Burp or Zap. With Sleepy Puppy, our workflow of testing now looks like this:


Testing is straightforward as Sleepy Puppy ships with a number of payloads, PuppyScripts, and an assessment. To provide a better sense of how Sleepy Puppy works in action, let’s take a look at an assessment we created for the XSS Challenge web application, a sample application that allows users to practice XSS testing.


To test the XSS Challenge web app, we created an assessment named 'XSS Game', which is highlighted above. When you click and highlight an assessment, you can see a number of payloads associated with this assessment. These payloads were automatically configured to have unique identifiers to help you correlate which payloads within your assessment have executed. Throughout the course of testing, counts of captures, collections, and access log requests are provided to quickly identify which payloads are executing. 

Simply copy any payload and inject it in the web application you are testing. Injecting Sleepy Puppy payloads in stored objects that may be reflected in other applications is highly recommended. 

The default PuppyScript configured for payloads captures useful metadata including the URL, DOM with payload highlighting, user-agent, cookies, referer header, and a screenshot of the application where the payload executed. This provides the tester ample knowledge to identify the impacted application so they may mitigate the vulnerability quickly. As payloads propagate throughout a network, the tester can trace what applications the payload has executed in. For more advanced use cases, security engineers can chain PuppyScripts together and even leverage the generic collector model to capture arbitrary data from any input source. 

After the payload executes, the tester will receive an email notification (if configured) and be presented with actionable data associated with the payload execution:


Here, the security engineer is able to view all of the information collected in Sleepy Puppy.  The researcher is presented with when the payload fired, url, referrer, cookies, user agent, DOM, and a screenshot.  


Architecture

Sleepy Puppy makes use of the following components :

  • Python 2.7 with Flask (including a number of helper packages)
  • SQLAlchemy with configurable backend storage
  • Ace Javascript editor for editing PuppyScripts
  • Html2Canvas JavaScript for screenshot capture
  • Optional use of AWS Simple Email Service (SES) for email notifications and S3 for screenshot storage

We’re shipping Sleepy Puppy with built-in payloads, PuppyScripts and a default assessment.


Getting Started

Sleepy Puppy is available now on the Netflix Open Source siteYou can try out Sleepy Puppy using Docker. Detailed instructions on setup and configuration are available on the wiki page.


Interested in Contributing?

Feel free to reach out or submit pull requests if there’s anything else you’re looking for. We hope you’ll find Sleepy Puppy as useful as we do!


Special Thanks

Thanks to Daniel Miessler for the extensive feedback after our Bay Area OWASP talk which was discussed in his blogpost.  


Conclusion

Sleepy Puppy is helping the Netflix security team identify XSS propagation through a number of systems even when those systems aren’t assessed directly. We hope that the open source community can find new and interesting uses for Sleepy Puppy, and use it to simplify their XSS testing and improve remediation times. Sleepy puppy is available on our GitHub site now!

Introducing Lemur

$
0
0
by: Kevin Glisson, Jason Chan and Ben Hagen

Netflix is pleased to announce the open source release of our x.509 certificate orchestration framework : Lemur!

The Challenge of Certificate Management
Public Key Infrastructureis a set of hardware, software, people, policies, and procedures needed to create, manage, distribute, use, store, and revoke digital certificates and manage public-key encryption. PKI allows for secure communication by establishing chains of trust between two entities.


There are three main components to PKI that we are attempting to address:
  1. Public Certificate - A cryptographic document that proves the ownership of a public key, which can be used for signing, proving identity or encrypting data.
  2. Private Key - A cryptographic document that is used to decrypt data encrypted by a public key.
  3. Certificate Authorities (CAs) - Third-party or internal services that validate those they do business with. They provide confirmation that a client is talking to the server it thinks it is. Their public certificates are loaded into major operating systems and provide a basis of trust for others to build on.


The management of all the pieces needed for PKI can be a confusing and painful experience. Certificates have expiration dates - if they are allowed to expire without replacing communication can be interrupted, impacting a system’s availability. And, private keys must never be exposed to any untrusted entities - any loss of a private key can impact the confidentiality of communications. There is also increased complexity when creating certificates that support a diverse pool of browsers and devices. It is non-trivial to track which devices and browsers trust which certificate authorities.


On top of the management of these sensitive and important pieces of information, the tools used to create manage and interact with PKI have confusing or ambiguous options. This lack of usability can lead to mistakes and undermine the security of PKI.


For non-experts the experience of creating certificates can be an intimidating one.


Empowering the Developer

At Netflix developers are responsible for their entire application environment, and we are moving to an environment that requires the use of HTTPS for all web applications. This means developers often have to go through the process of certificate procurement and deployment for their services. Let’s take a look at what a typical procurement process might look like:
Here we see an example workflow that a developer might take when creating a new service that has TLS enabled.


There are quite a few steps to this process and much of it is typically handled by humans. Let’s enumerate them:
  1. Create Certificate Signing Request (CSR) - A CSR is a cryptographically signed request that has information such as State/Province, Location, Organization Name and other details about the entity requesting the certificate and what the certificate is for. Creating a CSR typically requires the developer to use OpenSSL commands to generate a private key and enter the correct information. The OpenSSL command line contains hundreds of options and significant flexibility. This flexibility can often intimidate developers or cause them to make mistakes that undermine the security of the certificate.


  1. Submit CSR - The developer then submits the CSR to a CA. Where to submit the CSR can be confusing. Most organizations have internal and external CAs. Internal CAs are used for inter-service or inter-node communication anywhere you have control of both sides of transmission and can thus control who to trust. External CAs are typically used when you don’t have control of both sides of a transmission. Think about your browser communicating with a banking website over HTTPS. It relies on the trust built by third parties (Symantec/Digicert, GeoTrust etc.) in order to ensure that we are talking to who we think we are. External CAs are used for the vast majority of Internet-facing websites.


  1. Approve CSR - Due to the sensitive and error-prone nature of the certificate request process, the choice is often made to inject an approval process into the workflow. In this case, a security engineer would review that a request is valid and correct before issuing the certificate.


  1. Deploy Certificate - Eventually the issued certificate needs to be placed on a server that will handle the request. It’s now up to the developer to ensure that the keys and server certificates are correctly placed and configured on the server and that the keys are kept in a safe location.


  1. Store Secrets - An optional, but important step is to ensure that secrets can be retrieved at a later date. If a server ever needs to be re-deployed these keys will be needed in order to re-use the issued certificate.


Each of these steps have the developer moving through various systems and interfaces, potentially copying and pasting sensitive key material from one system to another. This kind of information spread can lead to situations where a developer might not correctly clean up the private keys they have generated or accidently expose the information, which could put their whole service at risk. Ideally a developer would never have to handle key material at all.


Toward Better Certificate Management

Certificate management is not a new challenge, tools like EJBCA, OpenCA, and more recently Let’s Encrypt are all helping to make certificate management easier. When setting out to make certificate management better we had two main goals: First, increase the usability and convenience of procuring a certificate in such a way that would not be intimidating to users. Second, harden the procurement process by generating high strength keys and handling them with care.


Meet Lemur!


Lemur

Lemur is a certificate management framework that acts as a broker between certificate authorities and internal deployment and management tools. This allows us to build in defaults and templates for the most common use cases, reduce the need for a developer to be exposed to sensitive key material, and provides a centralized location from which to manage and monitor all aspects of the certificate lifecycle.


We will use the following terminology throughout the rest of the discussion:


  • Issuers are internal or third-party certificate authorities
  • Destinations are deployment targets, for TLS these would be the servers terminating web requests.
  • Sources are any certificate store, these can include third party sources such as AWS, GAE, even source code.
  • Notifications are ways for a subscriber to be notified about a change with their certificate.


Unlike many of our tools Lemur is not tightly bound to AWS, in fact Lemur provides several different integration points that allows it to fit into just about any existing environment.


Security engineers can leverage Lemur to act as a broker between deployment systems and certificate authorities. It provides a unified view of, and tracks all certificates in an environment regardless of where they were issued.  


Let’s take a look at what a developer's new workflow would look like using Lemur:


Some key benefits of the new workflow are:
  • Developer no longer needs to know OpenSSL commands
  • Developer no longer needs to know how to safely handle sensitive key material
  • Certificate is immediately deployed and usable
  • Keys are generated with known strength properties
  • Centralized tracking and notification
  • Common API for internal users


This interface is much more forgiving than that of a command line and allows for helpful suggestions and input validation.
For advanced users, Lemur supports all certificate options that the target issuer supports.


Lemur’s destination plugins allow for a developer to pick an environment to upload a certificate. Having Lemur handle the propagation of sensitive material keeps it off developer’s laptops and ensures secure transmission. Out of the box Lemur supports multi-account AWS deployments. Over time, we hope that others can use the common plugin interface to fit their specific needs.


Even with all the things that Lemur does for us we knew there would use cases where certificates are not issued through Lemur. For example, a third party hosting and maintaining a marketing site, or a payment provider generating certificates for secure communication with their service.


To help with these use cases and provide the best possible visibility into an organization’s certificate deployment, Lemur has the concept of source plugins and the ability to import certificates. Source plugins allow Lemur to reach out into different environments and discover and catalog existing certificates, making them an easy way to bootstrap Lemur’s certificate management within an organization.

Lemur creates, discovers and deploys certificates. It also securely stores the sensitive key material created during the procurement process. Letting Lemur handle key management provides a centralized and known method of encryption and the ability to audit the key’s usage and access.


Architecture

Lemur makes use of the following components :
  • Python 2.7, 3.4 with Flask API (including a number of helper packages)
  • AngularJS UI
  • Postgres
  • Optional use of AWS Simple Email Service (SES) for email notifications
We’re shipping Lemur with built-in plugins for that allow you to issue certificates from Verisign/Symantec and allow for the discovery and deployment of certificates into AWS.


Getting Started

Lemur is available now on theNetflix Open Source site. You can try out Lemur usingDocker. Detailed instructions on setup and configuration are available in our docs.


Interested in Contributing?

Feel free to reach out or submit pull requests if you have any suggestions. We’re looking forward to seeing what new plugins you create to to make Lemur your own! We hope you’ll find Lemur as useful as we do!


Conclusion

Lemur is helping the Netflix security team manage our PKI infrastructure by empowering developers and creating a paved road to SSL/TLS enabled applications. Lemur is available on ourGitHub site now!

Announcing Electric Eye

$
0
0
By: Michael Russell

Electric Eye Icon
Netflix ships on a wide variety of devices, ranging from small thumbdrive-sized HDMI dongles to ultra-massive 100”+ curved screen HDTVs, and the wide variety of form factors leads to some interesting challenges in testing. In this post, we’re going to describe the genesis and evolution of Electric Eye, an automated computer vision and audio testing framework created to help test Netflix on all of these devices.

Let’s start with the Twenty-First Century Communications and Video Accessibility Act of 2010, or CCVA for short. Netflix creates closed caption files for all of our original programming, like Marvel’s Daredevil, Orange is the New Black, and House of Cards, and we serve closed captions for any content that we have captions for. Closed captions are sent to devices as Timed Text Markup Language (TTML), and describe what the captions should say, when and where they should appear, and when they should disappear, amongst other things. The code to display captions on devices is a combination of JavaScript served by our servers and native code on the devices. This led to an interesting question: How can we make sure that captions are showing up completely and on time? We were having humans do the work, but occasionally humans make mistakes. Given that CCVA is the law of the land, we wanted a relatively error-proof way of ensuring compliance.

If we only ran on devices with HDMI-out, we might be able to use something like stb-tester to do the work. However, we run on a wide variety of television sets, not all of which have HDMI-out. Factor in curved screens and odd aspect ratios, and it was starting to seem like there may not be a way to do this reliably for every device. However, one of the first rules of software is that you shouldn’t let your quest for perfection get in the way of making an incremental step forward.

We decided that we’d build a prototype using OpenCV to try to handle flat-screen televisions first, and broke the problem up into two different subproblems: obtaining a testable frame from the television, and extracting the captions from the frame for comparison. To ensure our prototype didn’t cost a lot of money, we picked up a few cheap 1080p webcams from a local electronics store.

OpenCV has functionality built in to detect a checkerboard pattern on a flat surface and generate a perspective-correction matrix, as well as code to warp an image based on the matrix, which made frame acquisition extremely easy. It wasn’t very fast (manually creating a lookup table using the perspective-correction matrix for use with remap improves the speed significantly), but this was a proof of concept. Optimization could come later.

The second step was a bit tricky. Television screens are emissive, meaning that they emit light. This causes blurring, ghosting, and other issues when they are being recorded with a camera. In addition, we couldn’t just have the captions on a black screen since decoding video could potentially cause enough strain on a device to cause captions to be delayed or dropped. Since we wanted a true torture test, we grabbed video of running water (one of the most strenuous patterns to play back due to its unpredictable nature), reduced its brightness by 50%, and overlaid captions on top of it. We’d bake “gold truth” captions into the upper part of the screen, show the results from parsed and displayed TTML in the bottom, and look for differences.

When we tested using HDMI capture, we could apply a thresholding algorithm to the frame and get the captions out easily.
Images showing captured and marked up frames
The frame on the left is what we got from HDMI capture after using thresholding.  We could then mark up the original frame received and send that to testers.
When we worked with the result from the webcam, things weren’t as nice.
Image showing excessive glare and spotting on a trivially thresholded webcam image
Raw thresholding didn't work as well.
Glare from ceiling lights led to unique issues, and even though the content was relatively high contrast, the emissive nature of the screen caused the water to splash through the captions.

While all of the issues that we found with the prototype were a bit daunting, they were eventually solved through a combination of environmental corrections (diffuse lighting handled most of the glare issues) and traditional OpenCV image cleanup techniques, and it proved that we could use CV to help test Netflix. The prototype was eventually able to reliably detect deltas of as little as 66ms, and it showed enough promise to let us create a second prototype, but also led to us adopting some new requirements.

First, we needed to be real-time on a reasonable machine. With our unoptimized code using the UI framework in OpenCV, we were getting ~20fps on a mid-2014 MacBook Pro, but we wanted to get 30fps reliably. Second, we needed to be able to process audio to enable new types of tests. Finally, we needed to be cross-platform. OpenCV works on Windows, Mac, and Linux, but its video capture interface doesn’t expose audio data.

For prototype #2, we decided to switch over to using a creative coding framework named Cinder. Cinder is a C++ library best known for its use by advertisers, but it has OpenCV bindings available as a “CinderBlock” as well as a full audio DSP library. It works on Windows and Mac, and work is underway on a Linux fork. We also chose a new test case to prototype: A/V sync. Getting camera audio and video together using Cinder is fairly easy to do if you follow the tutorials on the Cinder site.

The content for this test already existed on Netflix: Test Patterns. These test patterns were created specifically for Netflix by Archimedia to help us test for audio and video issues. On the English 2.0 track, a 1250Hz tone starts playing 400ms before the ball hits the bottom, and once there, the sound transitions over to a 200ms-long 1000Hz tone. The highlighted areas on the circle line up with when these tones should play. This pattern repeats every six seconds.

For the test to work, we needed to be able to tell what sound was playing. Cinder provides a MonitorSpectralNode class that lets us figure out dominant tones with a little work. With that, we could grab each frame as it came in, detect when the dominant tone changed from 1250Hz to 1000Hz, display the last frame that we got from the camera, and *poof* a simple A/V sync test.
Perspective-corrected image showing ghosting of patterns.
The next step was getting it so that we could find the ball on the test pattern and automate the measurement process. You may notice that in this image, you can see three balls: one at 66ms, one at 100ms, and one at 133ms. This is a result of a few factors: the emissive nature of the display, the camera being slightly out of sync with the TV, and pixel response time.

Through judicious use of image processing, histogram equalization, and thresholding, we were able to get to the point where we could detect the proper ball in the frame and use basic trigonometry to start generating numbers. We only had ~33ms of precision and +/-33ms of accuracy per measurement, but with sufficient sample sizes, the data followed a bell curve around what we felt we could report as an aggregate latency number for a device.
Test frame with location of orb highlighted and sample points overlaid atop the image.
Cinder isn’t perfect. We’ve encountered a lot of hardware issues for the audio pipeline because Cinder expects all parts of the pipeline to work at the same frequency. The default audio frequency on a MacBook Pro is 44.1kHz, unless you hook it up to a display via HDMI, where it changes to 48kHz. Not all webcams support both 44.1kHz and 48kHz natively, and when we can get device audio digitally, it should be (but isn’t always) 48kHz. We’ve got a workaround in place (forcing the output frequency to be the same as the selected input), and hope to have a more robust fix we can commit to the Cinder project around the time we release.

After five months of prototypes, we’re now working on version 1.0 of Electric Eye, and we’re planning on releasing the majority of the code as open source shortly after its completion. We’re adding extra tests, such as mixer latency and audio dropout detection, as well as looking at future applications like motion graphics testing, frame drop detection, frame tear detection, and more.

Our hope is that even if testers aren’t able to use Electric Eye in their work environments, they might be able to get ideas on how to more effectively utilize computer vision or audio processing in their tests to partially or fully automate defect detection, or at a minimum be motivated to try to find new and innovative ways to reduce subjectivity and manual effort in their testing.


John Carmack on Developing the Netflix App for Oculus

$
0
0

Hi, this is Anthony Park, VP of Engineering at Netflix. We've been working with Oculus to develop a Netflix app for Samsung Gear VR. The app includes a Netflix Living Room, allowing members to get the Netflix experience from the comfort of a virtual couch, wherever they bring their Gear VR headset. It's available to Oculus users today. We've been working closely with John Carmack, CTO of Oculus and programmer extraordinaire, to bring our TV user interface to the Gear VR headset. Well, honestly, John did most of the development himself(!), so I've asked him to be a guest blogger today and share his experience with implementing the new app. Here's a sneak peek at the experience, and I'll let John take it from here...


Netflix Living Room on Gear VR


The Netflix Living Room

Despite all the talk of hardcore gamers and abstract metaverses, a lot of people want to watch movies and shows in virtual reality. In fact, during the development of Gear VR, Samsung internally referred to it as the HMT, for "Head Mounted Theater." Current VR headsets can't match a high end real world home theater, but in many conditions the "best seat in the house" may be in the Gear VR that you pull out of your backpack.

Some of us from Oculus had a meeting at Netflix HQ last month, and when things seemed to be going well, I blurted out "Grab an engineer, let's do this tomorrow!"

That was a little bit optimistic, but when Vijay Gondi and Anthony Park came down from Netflix to Dallas the following week, we did get the UI running in VR on the second day, and video playing shortly thereafter.

The plan of attack was to take the Netflix TV codebase and present it on a virtual TV screen in VR. Ideally, the Netflix code would be getting events and drawing surfaces, not even really aware that it wasn't showing up on a normal 2D screen.

I wrote a "VR 2D Shell" application that functioned like a very simplified version of our Oculus Cinema application; the big screen is rendered with our peak-quality TimeWarp layer support, and the environment gets a neat dynamic lighting effect based on the screen contents. Anything we could get into a texture could be put on the screen.

The core Netflix application uses two Android Surfaces – one for the user interface layer, and one for the decoded video layer. To present these in VR I needed to be able to reference them as OpenGL textures, so the process was: create an OpenGL texture ID, use that to initialize a SurfaceTexture object, then use that to initialize a Surface object that could be passed to Netflix.

For the UI surface, this worked great -- when the Netflix code does a swapbuffers, the VR code can have the SurfaceTexture do an update, which will latch the latest image into an EGL external image, which can then be texture mapped onto geometry by the GPU.

The video surface was a little more problematic. To provide smooth playback, the video frames are queued a half second ahead, tagged with a "release time" that the Android window compositor will use to pick the best frame each update. The SurfaceTexture interface that I could access as a normal user program only had an "Update" method that always returned the very latest frame submitted. This meant that the video came out a half second ahead of the audio, and stuttered a lot.

To fix this, I had to make a small change in the Netflix video decoding system so it would call out to my VR code right after it submitted each frame, letting me know that it had submitted something with a particular release time. I could then immediately update the surface texture and copy it out to my own frame queue, storing the release time with it. This is an unfortunate waste of memory, since I am duplicating over a dozen video frames that are also being buffered on the surface, but it gives me the timing control I need.

Initially input was handled with a Bluetooth joypad emulating the LRUD / OK buttons of a remote control, but it was important to be able to control it using just the touchpad on the side of Gear VR. Our preferred VR interface is "gaze and tap", where a cursor floats in front of you in VR, and tapping is like clicking a mouse. For most things, this is better than gamepad control, but not as good as a real mouse, especially if you have to move your head significant amounts. Netflix has support for cursors, but there is the assumption that you can turn it on and off, which we don't really have.

We wound up with some heuristics driving the behavior. I auto-hide the cursor when the movie starts playing, inhibit cursor updates briefly after swipes, and send actions on touch up instead of touch down so you can perform swipes without also triggering touches. It isn't perfect, but it works pretty well.


Layering of the Android Surfaces within the Netflix Living Room


Display

The screens on the Gear VR supported phones are all 2560x1440 resolution, which is split in half to give each eye a 1280x1440 view that covers approximately 90 degrees of your field of view. If you have tried previous Oculus headsets, that is more than twice the pixel density of DK2, and four times the pixel density of DK1. That sounds like a pretty good resolution for videos until you consider that very few people want a TV screen to occupy a 90 degree field of view. Even quite large screens are usually placed far enough away to be about half of that in real life.

The optics in the headset that magnify the image and allow your eyes to focus on it introduce both a significant spatial distortion and chromatic aberration that needs to be corrected. The distortion compresses the pixels together in the center and stretches them out towards the outside, which has the positive effect of giving a somewhat higher effective resolution in the middle where you tend to be looking, but it also means that there is no perfect resolution for content to be presented in. If you size it for the middle, it will need mip maps and waste pixels on the outside. If you size it for the outside, it will be stretched over multiple pixels in the center.

For synthetic environments on mobile, we usually size our 3D renderings close to the outer range, about 1024x1024 pixels per eye, and let it be a little blurrier in the middle, because we care a lot about performance. On high end PC systems, even though the actual headset displays are lower resolution than Gear VR, sometimes higher resolution scenes are rendered to extract the maximum value from the display in the middle, even if the majority of the pixels wind up being blended together in a mip map for display.

The Netflix UI is built around a 1280x720 resolution image. If that was rendered to a giant virtual TV covering 60 degrees of your field of view in the 1024x1024 eye buffer, you would have a very poor quality image as you would only be seeing a quarter of the pixels. If you had mip maps it would be a blurry mess, otherwise all the text would be aliased fizzing in and out as your head made tiny movements each frame.

The technique we use to get around this is to have special code for just the screen part of the view that can directly sample a single textured rectangle after the necessary distortion calculations have been done, and blend that with the conventional eye buffers. These are our "Time Warp Layers". This has limited flexibility, but it gives us the best possible quality for virtual screens (and also the panoramic cube maps in Oculus 360 Photos). If you have a joypad bound to the phone, you can toggle this feature on and off by pressing the start button. It makes an enormous difference for the UI, and is a solid improvement for the video content.

Still, it is drawing a 1280 pixel wide UI over maybe 900 pixels on the screen, so something has to give. Because of the nature of the distortion, the middle of the screen winds up stretching the image slightly, and you can discern every single pixel in the UI. As you get towards the outer edges, and especially the corners, more and more of the UI pixels get blended together. Some of the Netflix UI layout is a little unfortunate for this; small text in the corners is definitely harder to read.

So forget 4K, or even full-HD. 720p HD is the highest resolution video you should even consider playing in a VR headset today.

This is where content protection comes into the picture. Most studios insist that HD content only be played in a secure execution environment to reduce opportunities for piracy. Modern Android systems' video CODECs can decode into special memory buffers that literally can't be read by anything other than the video screen scanning hardware; untrusted software running on the CPU and GPU have no ability to snoop into the buffer and steal the images. This happens at the hardware level, and is much more difficult to circumvent than software protections.

The problem for us is that to draw a virtual TV screen in VR, the GPU fundamentally needs to be able to read the movie surface as a texture. On some of the more recent phone models we have extensions to allow us to move the entire GPU framebuffer into protected memory and then get the ability to read a protected texture, but because we can't write anywhere else, we can't generate mip maps for it. We could get the higher resolution for the center of the screen, but then the periphery would be aliasing, and we lose the dynamic environment lighting effect, which is based on building a mip map of the screen down to 1x1. To top it all off, the user timing queue to get the audio synced up wouldn't be possible.

The reasonable thing to do was just limit the streams to SD resolution – 720x480. That is slightly lower than I would have chosen if the need for a secure execution environment weren't an issue, but not too much. Even at that resolution, the extreme corners are doing a little bit of pixel blending.
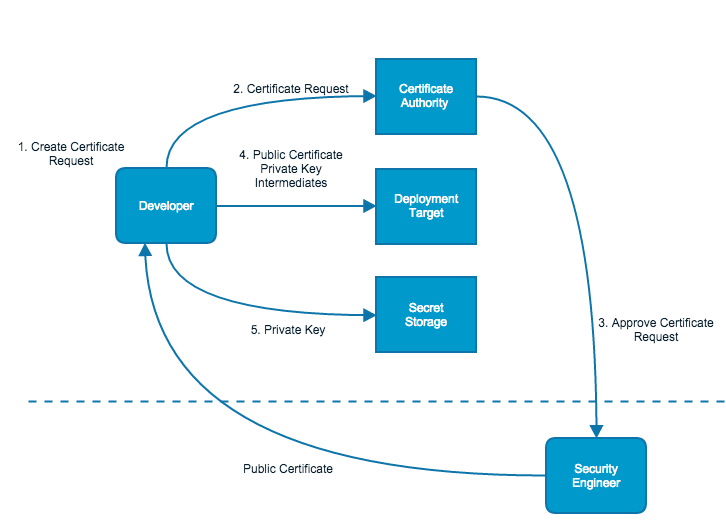

Flow diagram for SD video frames to allow composition with VR

In an ideal world, the bitrate / resolution tradeoff would be made slightly differently for VR. On a retina class display, many compression artifacts aren't really visible, but the highly magnified pixels in VR put them much more in your face. There is a hard limit to how much resolution is useful, but every visible compression artifact is correctable with more bitrate.


Power Consumption

For a movie viewing application, power consumption is a much bigger factor than for a short action game. My target was to be able to watch a two hour movie in VR starting at 70% battery. We hit this after quite a bit of optimization, but the VR app still draws over twice as much power as the standard Netflix Android app.

When a modern Android system is playing video, the application is only shuffling the highly compressed video data from the network to the hardware video CODEC, which decompresses it to private buffers, which are then read by the hardware composer block that performs YUV conversion and scaling directly as it feeds it to the display, without ever writing intermediate values to a framebuffer. The GPU may even be completely powered off. This is pretty marvelous – it wasn't too long ago when a PC might use 100x the power to do it all in software.

For VR, in addition to all the work that the standard application is doing, we are rendering stereo 3D scenes with tens of thousands of triangles and many megabytes of textures in each one, and then doing an additional rendering pass to correct for the distortion of the optics.

When I first brought up the system in the most straightforward way with the UI and video layers composited together every frame, the phone overheated to the thermal limit in less than 20 minutes. It was then a process of finding out what work could be avoided with minimal loss in quality.

The bulk of a viewing experience should be pure video. In that case, we only need to mip-map and display a 720x480 image, instead of composing it with the 1280x720 UI. There were no convenient hooks in the Netflix codebase to say when the UI surface was completely transparent, so I read back the bottom 1x1 pixel mip map from the previous frame's UI composition and look at the alpha channel: 0 means the UI was completely transparent, and the movie surface can be drawn by itself. 255 means the UI is solid, and the movie can be ignored. Anything in between means they need to be composited together. This gives the somewhat surprising result that subtitles cause a noticeable increase in power consumption.

I had initially implemented the VR gaze cursor by drawing it into the UI composition surface, which was a useful check on my intersection calculations, but it meant that the UI composition had to happen every single frame, even when the UI was completely static. Moving the gaze cursor back to its own 3D geometry allowed the screen to continue reusing the previous composition when nothing was changing, which is usually more than half of the frames when browsing content.

One of the big features of our VR system is the "Asynchronous Time Warp", where redrawing the screen and distortion correcting in response to your head movement is decoupled from the application's drawing of the 3D world. Ideally, the app draws 60 stereo eye views a second in sync with Time Warp, but if the app fails to deliver a new set of frames then Time Warp will reuse the most recent one it has, re-projecting it based on the latest head tracking information. For looking around in a static environment, this works remarkably well, but it starts to show the limitations when you have smoothly animating objects in view, or your viewpoint moves sideways in front of a surface.

Because the video content is 30 or 24 fps and there is no VR viewpoint movement, I cut the scene update rate to 30 fps during movie playback for a substantial power savings. The screen is still redrawn at 60 fps, so it doesn't feel any choppier when you look around. I go back to 60 fps when the lights come up, because the gaze cursor and UI scrolling animations look significantly worse at 30 fps.

If you really don't care about the VR environment, you can go into a "void theater", where everything is black except the video screen, which obviously saves additional power. You could even go all the way to a face-locked screen with no distortion correction, which would be essentially the same power draw as the normal Netflix application, but it would be ugly and uncomfortable.


A year ago, I had a short list of the top things that I felt Gear VR needed to be successful. One of them was Netflix. It was very rewarding to be able to do this work right before Oculus Connect and make it available to all of our users in such a short timeframe. Plus, I got to watch the entire season of Daredevil from the comfort of my virtual couch. Because testing, of course.

-John

Chaos Engineering Upgraded

$
0
0
Several years ago we introduced a tool called Chaos Monkey. This service pseudo-randomly plucks a server from our production deployment on AWS and kills it. At the time we were met with incredulity and skepticism. Are we crazy? In production?!?

Our reasoning was sound, and the results bore that out. Since we knew that server failures are guaranteed to happen, we wanted those failures to happen during business hours when we were on hand to fix any fallout. We knew that we could rely on engineers to build resilient solutions if we gave them the context to *expect* servers to fail. If we could align our engineers to build services that survive a server failure as a matter of course, then when it accidentally happened it wouldn’t be a big deal. In fact, our members wouldn’t even notice. This proved to be the case.

Chaos Kong

Building on the success of Chaos Monkey, we looked at an extreme case of infrastructure failure. We built Chaos Kong, which doesn’t just kill a server. It kills an entire AWS Region1.

It is very rare that an AWS Region becomes unavailable, but it does happen. This past Sunday (September 20th, 2015) Amazon’s DynamoDB service experienced an availability issue in their US-EAST-1 Region. That instability caused more than 20 additional AWS services that are dependent on DynamoDB to fail. Some of the Internet’s biggest sites and applications were intermittently unavailable during a six- to eight-hour window that day.


Netflix did experience a brief availability blip in the affected Region, but we sidestepped any significant impact because Chaos Kong exercises prepare us for incidents like this. By running experiments on a regular basis that simulate a Regional outage, we were able to identify any systemic weaknesses early and fix them. When US-EAST-1 actually became unavailable, our system was already strong enough to handle a traffic failover.

Below is a chart of our video play metrics during a Chaos Kong exercise. These are three views of the same eight hour window. The top view shows the aggregate metric, while the bottom two show the same metric for the west region and the east region, respectively.

Chaos Kong exercise in progress

In the bottom row, you can clearly see traffic evacuate from the west region. The east region gets a corresponding bump in traffic as it steps up to play the role of savior. During the exercise, most of our attention stays focused on the top row. As long as the aggregate metric follows that relatively smooth trend, we know that our system is resilient to the failover. At the end of the exercise, you see traffic revert to the west region, and the aggregate view shows that our members did not experience an adverse effects. We run Chaos Kong exercises like this on a regular basis, and it gives us confidence that even if an entire region goes down, we can still serve our customers.

ADVANCING THE MODEL

We looked around to see what other engineering practices could benefit from these types of exercises, and we noticed that Chaos meant different things to different people. In order to carry the practice forward, we need a best-practice definition, a model that we can apply across different projects and different departments to make our services more resilient.

We want to capture the value of these exercises in a methodology that we can use to improve our systems and push the state of the art forward. At Netflix we have an extremely complex distributed system (microservice architecture) with hundreds of deploys every day. We don’t want to remove the complexity of the system; we want to thrive on it. We want to continue to accelerate flexibility and rapid development. And with that complexity, flexibility, and rapidity, we still need to have confidence in the resiliency of our system.

To have our cake and eat it too, we set out to develop a new discipline around Chaos. We developed an empirical, systems-based approach which addresses the chaos inherent in distributed systems at scale. This approach specifically builds confidence in the ability of those systems to withstand realistic conditions. We learn about the behavior of a distributed system by observing it in a controlled experiment, and we use those learnings to fortify our systems before any systemic effect can disrupt the quality service that we provide our customers. We call this new discipline Chaos Engineering.

We have published the Principles of Chaos Engineering as a living document, so that other organizations can contribute to the concepts that we outline here.

CHAOS EXPERIMENT

We put these principles into practice. At Netflix we have a microservice architecture. One of our services is called Subscriber, which handles certain user management activities and authentication. It is possible that under some rare or even unknown situation Subscriber will be crippled. This might be due to network errors, under-provisioning of resources, or even by events in downstream services upon which Subscriber depends. When you have a distributed system at scale, sometimes bad things just happen that are outside any person’s control. We want confidence that our service is resilient to situations like this.

We have a steady-state definition: Our metric of interest is customer engagement, which we measure as the number of video plays that start each second. In some experiments we also look at load average and error rate on an upstream service (API). The lines that those metrics draw over time are predictable, and provide a good proxy for the steady-state of the system. We have a hypothesis: We will see no significant impact on our customer engagement over short periods of time on the order of an hour, even when Subscriber is in a degraded state. We have variables: We add latency of 30ms first to 20% then to 50% of traffic from Subscriber to its primary cache. This simulates a situation in which the Subscriber cache is over-stressed and performing poorly. Cache misses increase, which in turn increases load on other parts of the Subscriber service. Then we look for a statistically significant deviation between the variable group and the control group with respect to the system’s steady-state level of customer engagement.

If we find a deviation from steady-state in our variable group, then we have disproved our hypothesis. That would cause us to revisit the fallbacks and dependency configuration for Subscriber. We would undertake a concerted effort to improve the resiliency story around Subscriber and the services that it touches, so that customers can count on our service even when Subscriber is in a degraded state.

If we don’t find any deviation in our variable group, then we feel more confident in our hypothesis. That translates to having more confidence in our service as a whole.

In this specific case, we did see a deviation from steady-state when 30ms latency was added to 50% of the traffic going to this service. We identified a number of steps that we could take, such as decreasing the thread pool count in an upstream service, and subsequent experiments have confirmed the bolstered resiliency of Subscriber.

CONCLUSION

We started Chaos Monkey to build confidence in our highly complex system. We don’t have to simplify or even understand the system to see that over time Chaos Monkey makes the system more resilient. By purposefully introducing realistic production conditions into a controlled run, we can uncover weaknesses before they cause bigger problems. Chaos Engineering makes our system stronger, and gives us the confidence to move quickly in a very complex system.

STAY TUNED

This blog post is part of a series. In the next post on Chaos Engineering, we will take a deeper dive into the Principles of Chaos Engineering and hypothesis building with additional examples from our production experiments. If you have thoughts on Chaos Engineering or how to advance the state of the art in this field, we’d love to hear from you. Feel free to reach out to chaos@netflix.com.

-Chaos Team at Netflix
Ali Basiri, Lorin Hochstein, Abhijit Thosar, Casey Rosenthal


1. Technically, it only simulates killing an AWS Region. For our purposes, simulating this giant infrastructure failure is sufficient, and AWS doesn’t yet provide us with a way of turning off an entire region. ;-)

Creating Your Own EC2 Spot Market

$
0
0
by: Andrew Park, Darrell Denlinger, & Coburn Watson

Netflix prioritizes innovation and reliability above efficiency, and as we continue to scale globally, finding opportunities that balance these three variables becomes increasingly difficult. However, every so often there is a process or application that can shift the curve out on all three factors; for Netflix this process was incorporating hybrid autoscaling engines for our services via Scryer& Amazon Auto Scaling.


Currently over 15% of our EC2 footprint autoscales, and the majority of this usage is covered by reserved instances as we value the pricing and capacity benefits. The combination of these two factors have created an “internal spot market” that has a daily peak of over 12,000 unused instances. We have been steadily working on building an automated system that allows us to effectively utilize these troughs.


Creating the internal spot capacity is straightforward: implement auto scaling and purchase reserved instances. In this post we’ll focus on how to leverage this trough given the complexities that stem from our large scale and decentralized microservice architecture. In the upcoming posts, we will discuss the technical details in automating Netflix’s internal spot market and highlight some of the lessons learned.


How the internal spot began


The initial foray into large scale borrowing started in the Spring of 2015. A new algorithm for one of our personalization services ballooned their video ranking precompute cluster, expanding the size by 5x overnight. Their precompute cluster had an SLA to complete their daily jobs between midnight and 11am, leaving over 1,500 r3.4xlarges unused during the afternoon and evening.


Motivated by the inefficiencies, we actively searched for another service that had relatively interruptible jobs that could run during the off-hours. The Encoding team, who is responsible for converting the raw master video files into consumable formats for our device ecosystem, was the perfect candidate. The initial approach applied was a borrowing schedule based on historical availability, with scale-downs manually communicated between the Personalization, Encoding, and Cloud Capacity teams.


Preliminary Manual Borrowing


As the Encoding team continued to reap the benefits of the extra capacity, they became interested in borrowing from the various sizable troughs in other instance types. Because of a lack of real time data exposing the unused capacity between our accounts, we embarked on a multi-team effort to create the necessary tooling and processes to allow borrowing to occur on a larger, more automated scale.


Current Automated Borrowing


Borrowing considerations


The first requirement to automated borrowing is building out the telemetry exposing unused reservation counts. Given our autoscaling engines operate at a minute granularity, we could not leverage AWS’ billing file as our data source. Instead, the Engineering Tools team built an API inside our deployment platform that exposed real time unused reservations at the minute level. This unused calculation combined input data from our deployment tool, monitoring system, and AWS’ reservation system.


The second requirement is finding batch jobs that are short in duration or interruptible in nature. Our batch Encoding jobs had a minimum duration SLA between five minutes to an hour, making them a perfect fit for our initial twelve hour borrowing window. An additional benefit is having jobs that are resource agnostic, allowing for more borrowing opportunities as our usage landscape creates various troughs by instance type.


The last requirement is for teams to absorb the telemetry data and to set appropriate rules for when to borrow instances. The main concern was whether or not this borrowing would jeopardize capacity for services in the critical path. We alleviated this issue by placing all of our borrowing into a separate account from our production account and leveraging the financial advantages of consolidated billing. Theoretically, a perfectly automated borrowing system would have the same operational and financial results regardless of account structure, but leveraging consolidated billing creates a capacity safety net.


Conclusion


In the ideal state, the internal spot market can be the most efficient platform for running short duration or interruptible jobs through instance level bin-packing. A series of small steps moved us in the right direction, such as:
  • Identifying preliminary test candidates for resource sharing
  • Creating shorter run-time jobs or modifying jobs to be more interruptible
  • Communicating broader messaging about resource sharing
In our next post in this series, the Encoding team will talk through their use cases of the internal spot market, depicting the nuances of real time borrowing at such scale. Their team is actively working through this exciting efficiency problem and many others at Netflix; please check our Jobs site if you want to help us solve these challenges!

Moving from Asgard to Spinnaker

$
0
0
Six years ago, Netflix successfully jumped headfirst into the AWS Cloud and along the way we ended up writing quite a lot of software to help us out. One particular project proved instrumental in allowing us to efficiently automate AWS deployments: Asgard

Asgard created an intuitive model for cloud-based applications that has made deployment and ongoing management of AWS resources easy for hundreds of engineers at Netflix. Introducing the notion of clusters, applications, specific naming conventions, and deployment options like rolling push and red/black has ultimately yielded more productive teams who can spend more time coding business logic rather than becoming AWS experts.  What’s more, Asgard has been a successful OSS project adopted by various companies. Indeed, the utility of Asgard’s battle-hardened AWS deployment and management features is undoubtedly due to the hard work and innovation of its contributors both within Netflix and the community.

Netflix, nevertheless, has evolved since first embracing the cloud. Our footprint within AWS has expanded to meet the demand of an increasingly global audience; moreover, the number of applications required to service our customers has swelled. Our rate of innovation, which maintains our global competitive edge, has also grown. Consequently, our desire to move code rapidly, with a high degree of confidence and overall visibility, has also increased. In this regard Asgard has fallen short.

Everything required to produce a deployment artifact, in this case an AMI, has never been addressed in Asgard. Consequently, many teams at Netflix constructed their own Continuous Delivery workflows. These workflows were typically related Jenkins jobs that tied together code check-ins with building and testing, then AMI creations and, finally, deployments via Asgard. This final step involved automation against Asgard’s REST API, which was never intended to be leveraged as a first class citizen.

Roughly a year ago a new project, dubbed Spinnaker, kicked off to enable end-to-end global Continuous Delivery at Netflix. The goals of this project were to create a Continuous Delivery platform that would:
  • enable repeatable automated deployments captured as flexible pipelines and configurable pipeline stages
  • provide a global view across all the environments that an application passes through in its deployment pipeline
  • offer programmatic configuration and execution via a consistent and reliable API
  • be easy to configure, maintain, and extend  
  • be operationally resilient  
  • provide the existing benefits of Asgard without a migration


    What’s more, we wanted to leverage a few lessons learned from Asgard. One particular goal of this new platform is to facilitate innovation within its umbrella. The original Asgard model was difficult to extend so the community forked Asgard to provide alternative implementations. Since these changes weren’t merged back into Asgard, those innovations were lost to the wider community. Spinnaker aims to make it easier to extend and enhance cloud deployment models in a way that doesn't require forking. Whether the community desires additional cloud providers, different deployment artifacts or new stages in a Continuous Delivery pipeline, extensions to Spinnaker will be available to everyone in the community without the need to fork. 

    We additionally wanted to create a platform that, while replacing Asgard, doesn’t exclude it. A big-bang migration process off Asgard would be out of the question for Netflix and for the community. Consequently, changes to cloud assets via Asgard are completely compatible with changes to those same assets via our new platform. And vice versa!

    Finally, we deliberately chose not to reimplement everything in Asgard. Ultimately, Asgard took on too much undifferentiated heavy lifting from the AWS console. Consequently, for those features that are not directly related to cluster management, such as SNS, SQS, and RDS Management, Netflix users and the community are encouraged to use the AWS Console.

    Our new platform only implements those Asgard-like features related to cluster management from the point of view of an application (and even a group of related applications: a project). This application context allows you to work with a particular application’s related clusters, ASGs, instances, Security Groups, and ELBs, in all the AWS accounts in which the application is deployed.

    Today, we have both systems running side by side with the vast majority of all deployments leveraging our new platform. Nevertheless, we’re not completely done with gaining the feature parity we desire with Asgard. That gap is closing rapidly and in the near future we will be sunsetting various Asgard instances running in our infrastructure. At this point, Netflix engineers aren’t committing code to Asgard’s Github repository; nevertheless, we happily encourage the OSS community’s active participation in Asgard going forward. 

    Asgard served Netflix well for quite a long time. We learned numerous lessons along our journey and are ready to focus on the future with a new platform that makes Continuous Delivery a first-class citizen at Netflix and elsewhere. We plan to share this platform, Spinnaker, with the Open Source Community in the coming months.

    -Delivery Engineering Team at Netflix 

    Flux: A New Approach to System Intuition

    $
    0
    0
    First level of Flux

    On the Traffic and Chaos Teams at Netflix, our mission requires that we have a holistic understanding of our complex microservice architecture. At any given time, we may be called upon to move the request traffic of many millions of customers from one side of the planet to the other. More frequently, we want to understand in real time what effect a variable is having on a subset of request traffic during a Chaos Experiment. We require a tool that can give us this holistic understanding of traffic as it flows through our complex, distributed system.


    The two use cases have some common requirements. We need:
    • Realtime data.
    • Data on the volume, latency, and health of requests.
    • Insight into traffic at the network edge.
    • The ability to drill into IPC traffic.
    • Dependency information about the microservices as requests travel through the system.

    So far, these requirements are rather standard fare for a network monitoring dashboard. Aside from the actual amount of traffic that Netflix handles, you might find a tool at that accomplishes the above at any undifferentiated online service.

    Here’s where it gets interesting.

    In general, we assume that if anything is best represented numerically, then we don’t need to visualize it. If the best representation is a numerical one, then a visualization could only obscure a quantifiable piece of information that can be measured, compared, and acted upon. Anything that we can wrap in alerts or some threshold boundary should kick off some automated process. No point in ruining a perfectly good system by introducing a human into the mix.

    Instead of numerical information, we want a tool that surfaces relevant information to a human, for situations that would be too onerous to create a heuristic. These situations require an intuition that we can’t codify.

    If we want to be able to intuit decisions about the holistic state of the system, then we are going to need a tool that gives us an intuitive understanding of the system. The network monitoring dashboards that we are familiar with won’t suffice. The current industry tools present data and charts, but we want a something that will let us feel the traffic and the state of the system.

    In trying to explain this requirement for a visceral, gut-level understanding of the system, we came up with a metaphor that helps illustrate the point. It’s absurd, but explanatory.

    Let's call it the "Pain Suit."
    Imagine a suit that is wired with tens of thousands of electrodes. Electrode bundles correspond to microservices within Netflix. When a Site Reliability Engineer is on call, they have to wear this suit. As a microservice experiences failures, the corresponding electrodes cause a painful sensation. We call this the “Pain Suit.”

    Now imagine that you are wearing the Pain Suit for a few short days. You wake up one morning and feel a pain in your shoulder. “Of course,” you think. “Microservice X is misbehaving again.” It would not take you long to get a visceral sense of the holistic state of the system. Very quickly, you would have an intuitive understanding of the entire service, without having any numerical facts about any events or explicit alerts.

    It is our contention that this kind of understanding, this mechanical proprioception, is not only the most efficient way for us to instantly have a holistic understanding, it is also the best way to surface relevant information in a vast amount of data to a human decision maker. Furthermore, we contend that even brief exposure to this type of interaction with the system leads to insights that are not easily attained in any other way.

    Of course, we haven’t built a pain suit. [Not yet. ;-)]

    Instead, we decided to take advantage of the brain’s ability to process massive amounts of visual information in multiple dimensions, in parallel, visually. We call this tool Flux.

    In the home screen of Flux, we get a representation of all traffic coming into Netflix from the Internet, and being directed to one of our three AWS Regions. Below is a video capture of this first screen in Flux during a simulation of a Regional failover:


    The circle in the center represents the Internet. The moving dots represent requests coming in to our service from the Internet. The three Regions are represented by the three peripheral circles. Requests are normally represented in the bluish-white color, but errors and fallbacks are indicated by other colors such as red.

    In this simulation, you can see request errors building up in the region in the upper left [victim region] for the first twenty seconds or so. The cause of the errors could be anything, but the relevant effect is that we can quickly see that bad things are happening in the victim region.

    Around twenty seconds into the video, we decide to initiate a traffic failover. For the following 20 seconds, the requests going to the victim region are redirected to the upper right region [savior region] via an internal proxy layer. We take this step so that we can programmatically control how much traffic is redirected to the savior region while we scale it up. In this situation we don’t have enough extra capacity running hot to instantly fail over, so scaling up takes some time.

    The inter-region traffic from victim to savior increases while the savior region scales up. At that point, we switch DNS to point to the savior region. For about 10 seconds you see traffic to the victim region die down as DNS propagates. At this point, about 56 seconds in, nearly all of the victim region’s traffic is now pointing to the savior region. We hold the traffic there for about 10 seconds while we ‘fix’ the victim region, and then we revert the process.

    The victim region has been fixed, and we end the demo with traffic more-or-less evenly distributed. You may have noticed that in this demonstration we only performed a 1:1 mapping of victim to savior region traffic. We will speak to more sophisticated failover strategies in future posts.

    RESULTS

    Even before Flux v1.0 was up and running, when it was still in Alpha on a laptop, it found an issue in our production system. As we were testing real data, Justin noticed a stream that was discolored in one region. “Hey, what’s that?” led to a short investigation which revealed that our proxy layer had not scaled to a proper size on the most recent push in that region and was rejecting SSO requests. Flux in action!

    Even a split-second glance at the Flux interface is enough to show us the health of the system. Without reading any numbers or searching for any particular signal, we instantly know by the color and motion of the elements on the screen whether the service is running properly. Of course if something is really wrong with the service, it will be highly visible. More interesting to us, we start to get a feeling when things are right in the system even before the disturbance is quantifiable.

    STAY TUNED

    This blog post is part of a series. In the next post on Flux, we will look at two layers that are deeper than the regional view, and talk specifically about the implementation. If you have thoughts on experiential tools like this or how to advance the state of the art in this field, we’d love to hear your feedback. Feel free to reach out to traffic@netflix.com.

    -Traffic Team at Netflix
    Luke Kosewski, Jeremy Tatelman, Justin Reynolds, Casey Rosenthal


    Netflix at AWS re:Invent 2015

    $
    0
    0
    Ever since AWS started the re:Invent conference, Netflix has actively participated each and every year.  This year is no exception, and we’re planning on presenting at 8 different sessions. The topics span the domains of availability, engineering velocity, security, real-time analytics, big data, operations, cost management, and efficiency all at web scale.


    In the past, our sessions have received a lot of interest, so we wanted to share the schedule in advance, and provide a summary of the topics and how they might be relevant to you and your company.  Please join us at re:Invent if you’re attending. After the conference, we will link slides and videos to this same post.


    ISM301 - Engineering Global Operations in the Cloud
    Wednesday, Oct 7, 11:00AM - Palazzo N
    Josh Evans, Director of Operations Engineering


    Abstract: Operating a massively scalable, constantly changing, distributed global service is a daunting task. We innovate at breakneck speed to attract new customers and stay ahead of the competition. This means more features, more experiments, more deployments, more engineers making changes in production environments, and ever increasing complexity. Simultaneously improving service availability and accelerating rate of change seems impossible on the surface. At Netflix, Operations Engineering is both a technical and organizational construct designed to accomplish just that by integrating disciplines like continuous delivery, fault-injection, regional traffic management, crisis response, best practice automation, and real-time analytics. In this talk, designed for technical leaders seeking a path to operational excellence, we'll explore these disciplines in depth and how they integrate and create competitive advantages.


    ISM309- Efficient Innovation - High Velocity Cost Management at Netflix
    Wednesday, Oct 7, 2:45PM- Palazzo C
    Andrew Park, Manager FPNA


    Abstract: At many high growth companies, staying at the bleeding edge of innovation and maintaining the highest level of availability often sideline financial efficiency goals. This problem is exacerbated in a micro-service environment where decentralized engineering teams can spin up thousands of instances at a moment’s notice, with no governing body tracking financial or operational budgets. But instead of allowing costs to spin out of control causing senior leaders to have a “knee-jerk” reaction to rein in costs, there are  proactive and reactive initiatives one can pursue to replace high velocity cost with efficient innovation. Primarily, these initiatives revolve around developing a positive cost-conscious culture and assigning the responsibility of efficiency to the appropriate business owners.

    At Netflix, our Finance and Operations Engineering teams bear that responsibility to ensure the rate of innovation is not only fast, but also efficient. In the following presentation, we’ll cover the building blocks of AWS cost management and discuss the best practices used at Netflix.

    BDT318 -  Netflix Keystone - How Netflix handles Data Streams up to 8 Million events per second
    Wednesday, Oct 7, 2:45PM - San Polo 3501B
    Peter Bakas, Director of Event and Data Pipelines


    Abstract: In this talk, we will provide an overview of Keystone - Netflix's new Data Pipeline. We will cover our migration from Suro to Keystone - including the reasons behind the transition and the challenges of zero loss to the over 400 billion events we process daily.  We will discuss in detail how we deploy, operate and scale Kafka, Samza, Docker and Apache Mesos in AWS to manage 8 million events & 17 GB per second during peak.


    DVO203 - A Day in the Life of a Netflix Engineer using 37% of the Internet
    Wednesday, Oct 7, 4:15PM - Venetian H
    Dave Hahn, Senior Systems Engineer & AWS Liaison


    Abstract: Netflix is a large and ever-changing ecosystem made up of:
    * hundreds of production changes every hour
    * thousands of micro services
    * tens of thousands of instances
    * millions of concurrent customers
    * billions of metrics every minute

    And I'm the guy with the pager.

    An in-the-trenches look at what operating at Netflix scale in the cloud is really like. How Netflix views the velocity of innovation, expected failures, high availability, engineer responsibility, and obsessing over the quality of the customer experience. Why Freedom & Responsibility key, trust is required, and why chaos is your friend.


    SPOT302 -  Availability: The New Kind of Innovator’s Dilemma
    Wednesday, Oct 7, 4:15PM - Marcello 4501B
    Coburn Watson, Director of Reliability and Performance Engineering


    Abstract: Successful companies, while focusing on their current customers' needs, often fail to embrace disruptive technologies and business models. This phenomenon, known as the "Innovator's Dilemma," eventually leads to many companies' downfall and is especially relevant in the fast-paced world of online services. In order to protect its leading position and grow its share of the highly competitive global digital streaming market, Netflix has to continuously increase the pace of innovation by constantly refining recommendation algorithms and adding new product features, while maintaining a high level of service uptime. The Netflix streaming platform consists of hundreds of microservices that are constantly evolving, and even the smallest production change may cause a cascading failure that can bring the entire service down. We face a new kind of Innovator's Dilemma, where product changes may not only disrupt the business model but also cause production outages that deny customers service access. This talk will describe various architectural, operational and organizational changes adopted by Netflix in order to reconcile rapid innovation with service availability.


    BDT207 -  Real-Time Analytics In Service of Self-Healing Ecosystems
    Wednesday, Oct 7, 4:15PM - Lido 3001B
    Roy Rappoport, Manager of Insight Engineering
    Chris Sanden, Senior Analytics Engineer


    Abstract: Netflix strives to provide an amazing experience to each member.  To accomplish this, we need to maintain very high availability across our systems.  However, at a certain scale humans can no longer scale their ability to monitor the status of all systems, making it critical for us to build tools and platforms that can automatically monitor our production environments and make intelligent real-time operational decisions to remedy the problems they identify.


    In this talk, we'll discuss how Netflix uses data mining and machine learning techniques to automate decisions in real-time with the goal of supporting operational availability, reliability, and consistency.  We'll review how we got to the current states, the lessons we learned, and the future of Real-Time Analytics at Netflix.  


    While Netflix's scale is larger than most other companies, we believe the approaches and technologies we intend to discuss are highly relevant to other production environments, and an audience member will come away with actionable ideas that should be implementable in, and will benefit, most other environments.  


    BDT303 - Running Spark and Presto in Netflix Big Data Platform
    Thursday, Oct 8, 11:00AM - Palazzo F
    Eva Tse, Director of Engineering - Big Data Platform
    Daniel Weeks, Engineering Manager - Big Data Platform


    Abstract: In this talk, we will discuss how Spark & Presto complement our big data platform stack that started with Hadoop; and the use cases that they address. Also, we will discuss how we run Spark and Presto on top of the EMR infrastructure. Specifically, how we use S3 as our DW and how we leverage EMR as a generic data processing cluster management framework.


    SEC310 - Splitting the Check on Compliance and Security: Keeping Developers and Auditors Happy in the Cloud
    Thursday, Oct 8, 11:00AM - Marcello 4501B
    Jason Chan, Director of Cloud Security


    Abstract: Often times - developers and auditors can be at odds. The agile, fast-moving environments that developers enjoy will typically give auditors heartburn. The more controlled and stable environments that auditors prefer to demonstrate and maintain compliance are traditionally not friendly to developers or innovation. We'll walk through how Netflix moved its PCI and SOX environments to the cloud and how we were able to leverage the benefits of the cloud and agile development to satisfy both auditors and developers. Topics covered will include shared responsibility, using compartmentalization and microservices for scope control, immutable infrastructure, and continuous security testing.


    We also have a booth on the show floor where the speakers and other Netflix engineers will hold office hours.  We hope you join us for these talks and stop by our booth and say hello!

    Innovating SSO with Google For Work

    $
    0
    0
    The modern workforce deserves access to technology that will help them work the way they want to in this increasingly mobile world. When Netflix moved to Google Apps, employees and contractors quickly adopted the Google experience, from signing into Gmail, to saving files on Drive, to creating and sharing documents. They are now so accustomed to the Google Apps login flow, down to the two-factor authentication, that we wanted to make Google their central sign on service for all cloud apps, not just Google Apps for Work or apps in the Google Apps Marketplace.  


    A growing number of companies like us are looking to Google Apps for Work to be their central sign on service for good reason. Google gives today's highly mobile workforces access to all the cloud applications they need to do their jobs from anywhere on any device, all with a familiar and trusted user experience.


    Netflix has a complex workforce environment with more than 400 cloud applications, many of which were custom-built for specific use cases unique to our business. This was part of the challenge we came up against in making Google Apps for Work a truly universal SSO solution. Also, Google provides the key components foundational to a secure central access point for employees and contractors to access cloud apps, but we needed more granular contextual control over who could access the apps. For example, someone in the marketing department doesn’t always need to use an app that’s built specifically for the finance department.


    The second challenge was that we needed it to be as straightforward as possible to deploy apps across the organization without making developers jump through unnecessary hoops just to get them onto the single sign-on environment. For this we built libraries supporting all common programming languages used at Netflix.


    At Netflix, the security context from application to application is quite complex. Google is focused on providing business critical solutions like serving as the central secure access point for cloud apps, while also providing infrastructure for these services like the identity directory. We trust Google to play this foundational role, but wouldn’t expect it to meet unique needs that fall between the directory and the login for every one of its customers.


    We decided to bring in Ping Identity to fill these gaps. Ping’s Identity Defined Security platform serves as the glue that enables our workforce to have seamless and secure access to the additional apps and services needed while giving our IT team the control over securing application access that we need. Ping also helps us empower developers to build and deploy new apps based on standards so the workforce can use them securely, quickly and easily in this single sign-on environment.


    No cutting edge SSO solution is made up of just one component. We have packaged ours, and run the non-SaaS components in AWS architected for high availability and performance like any other Netflix service. Our employees, contractors, and application owners consume a true IDaaS solution. We have built it in such a way that as the Identity landscape continues to improve, we can add or remove pieces from the authentication chain without being disruptive to users.


    We’ve been working closely with Eric Sachs and Google’s identity team as well as Ping Identity’s CTO office to make this into a reality. I will talk about our experience with Google and Ping Identity tomorrow at Identify 2015 in New York, on October 21 in San Francisco, and on November 18 in London. My colleague, Google’s Product Management Director for Identity, Eric Sachs, will also be at these events to discuss how these same standards can be used in work and consumer-facing identity systems. If you’re interested in the Identity space, and would like to discuss in more depth what we have done, please reach out to me. Also feel free to look at our job postings in this space here.


    Falcor for Android

    $
    0
    0
    Falcor Logo
    We’re happy to have open-sourced the Netflix Falcor library earlier this year. On Android, we wanted to make use of Falcor in our client app for its efficient model of data fetching as well as its inherent cache coherence.

    Falcor requires us to model data on both the client and the server in the same way (via a path query language). This provides the benefit that clients don’t need any translation to fetch data from the server (see What is Falcor). For example, the application may request path [“video”, 12345, “summary”] from Falcor and if it doesn’t exist locally then Falcor can request this same path from the server.


    Another benefit that Falcor provides is that it can easily combine multiple paths into a single http request. Standard REST APIs may be limited in the kind of data they can provide via one specific URL. However Falcor’s path language allows us to retrieve any kind of data the client needs for a given view (see the “Batching” heading in “How Does Falcor Work?”). This also provides a nice mechanism for prefetching larger chunks of data if needed, which our app does on initialization.

    The Problem

    Being the only Java client at Netflix necessitated writing our own implementation of Falcor. The primary goal was to increase the efficiency of our caching code, or in other words, to decrease the complexity and maintenance costs associated with our previous caching layer. The secondary goal was to make these changes while maintaining or improving performance (speed & memory usage).

    The main challenge in doing this was to swap out our existing data caching layer for the new Falcor component with minimal impact on app quality. This warranted an investment in testing to validate the new caching component but how could we do this extensive testing most efficiently?

    Some history: prior to our Falcor client we had not made much of an investment in improving the structure or performance of our cache. After a light-weight first implementation, our cache had grown to be incoherent (same item represented in multiple places in memory) and the code was not written efficiently (lots of hand-parsing of individual http responses). None of this was good.

    Our Solution

    Falcor provides cache coherence by making use of a JSON Graph. This works by using a custom path language to define internal references to other items within the JSON document. This path language is consistent to Falcor, and thus a path or reference used locally on the client will be the same path or reference when sent to the server.

    {
       "topVideos":{
           // List, with indices
           0:{ $type:"ref", value:["video",123]},// JSON Graph reference
            1:{ $type:"ref", value:["video",789]}
       },
       "video":{
           // Videos by ID
           123:{
               "name":"Orange Is the New Black",
               "year":2015,
               ...
           },
           789:{
               "name":"House of Cards",
               "year":2015,
               ...
           }
       }
    }

    Our original cache made use of the gson library for parsing model objects and we had not implemented any custom deserializers. This meant we were implicitly using reflection within gson to handle response parsing. We were curious how much of a cost this use of reflection introduced when compared with custom deserialization. Using a subset of model objects, we wrote a benchmark app that showed the deserialization using reflection took about 6x as much time to process when compared with custom parsing.

    We used the transition to Falcor as an opportunity to write custom deserializers that took json as input and correctly set fields within each model. There is a slightly higher cost here to write parsing code for the models. However most models are shared across a few different get requests so the cost becomes amortized and seemed worth it considering the improved parsing speed.

    // Custom deserialization method for Video.Summary model
    public void populate(JsonElement jsonElem) {
       JsonObject json = jsonElem.getAsJsonObject();
       for(Map.Entry<String, JsonElement> entry : json.entrySet()){
           JsonElement value = entry.getValue();
           switch(entry.getKey()){
           case"id": id = value.getAsString();break;
           case"title": title = value.getAsString();break;
           ...
           }
       }
    }

    Once the Falcor cache was implemented, we compared cache memory usage over a typical user browsing session. As provided by cache coherence (no duplicate objects), we found that the cache footprint was reduced by about 10-15% for a typical user browse session, or about 500kB.

    Performance and Threading

    When a new path of data is requested from the cache, the following steps occur:
    1. Determine which paths, if any, already exist locally in the cache
    2. Aggregate paths that don't exist locally and request them from the server
    3. Merge server response back into the local cache
    4. Notify callers that data is ready, and/or pass data back via callback methods
    We generalized these operations in a component that also managed threading. By doing this, we were able to take everything off of the main thread except for task instantiation. All other steps above are done in worker threads.

    Further, by isolating all of the cache and remote operations into a single component we were easily able to add performance information to all requests. This data could be used for testing purposes (by outputting to a specific logcat channel) or simply as a debugging aid during development.

    // Sample logcat output
    15:29:10.956: FetchDetailsTask ++ time to build paths: 0ms
    15:29:10.956: FetchDetailsTask ++ time to check cache for missing paths: 1ms
    15:29:11.476: FetchDetailsTask ~~ http request took: 516ms
    15:29:11.486: FetchDetailsTask ++ time to parse json response: 8ms
    15:29:11.486: FetchDetailsTask ++ time to fetch results from cache: 0ms
    15:29:11.486: FetchDetailsTask == total task time from creation to finish: 531ms

    Testing

    Although reflection had been costly for the purposes of parsing json, we were able to use reflection on interfaces to our advantage when it came to testing our new cache. In our test harness, we defined tables that mapped test interfaces to each of the model classes. For example, when we made a request to fetch a ShowDetails object, the map defined that the ShowDetails and Playable interfaces should be used to compare the results.

    // INTERFACE_MAP sample entries
    put(netflix.model.branches.Video.Summary.class,            // Model/class
       newClass<?>[]{netflix.model._interfaces.Video.class});// Interfaces to test
    put(netflix.model.ShowDetails.class,
       newClass<?>[]{netflix.model._interfaces.ShowDetails.class,
                      netflix.model._interfaces.Playable.class});
    put(netflix.model.EpisodeDetails.class,
       newClass<?>[]{netflix.model._interfaces.EpisodeDetails.class,
                      netflix.model._interfaces.Playable.class});
    // etc.

    We then used reflection on the interfaces to get a list of all their methods and then recursively apply each method to each item or item in a list. The return values for the method/object pair were compared to find any differences between the previous cache implementation and the Falcor implementation. This provided a first-pass of detection for errors in the new implementation and caught most problems early on.

    private Result validate(Object o1, Object o2) {   //...snipped...   Class<?>[] validationInterfaces = INTERFACE_MAP.get(o1.getClass());
       for(Class<?> testingInterface : validationInterfaces){       Log.d(TAG,"Getting methods for interface: "+ testingInterface);       Method[] methods = testingInterface.getMethods();// Public methods only
           for(Method method : methods){           Object rtn1 = method.invoke(o1);// Old cache object           Object rtn2 = method.invoke(o2);// Falcor cache object
               if(rtn1 instanceof FalcorValidator){               Result rtn = validate(rtn1, rtn2);// Recursively validate objects               if(rtn.isError()){                   return rtn;               }           }           elseif(! rtn1.equals(rtn2)){               return Result.VALUE_MISMATCH.append(rtnMsg);           }       }   }   return Result.OK;}

    Bonus for Debugging

    Because of the structure of the Falcor cache, writing a dump() method was trivial using recursion. This became a very useful utility for debugging since it can succinctly express the whole state of the cache at any point in time, including all internal references. This output can be redirected to the logcat output or to a file.

    void doCacheDumpRecursive(StringBuilder output, BranchNode node, int offset) {
       StringBuilder sb =new StringBuilder();
       for(int i =0; i < offset; i++){
           sb.append((i == offset -1)?" |-":" | "); // Indentation chars
       }
       String spacer = sb.toString();
       for(String key : keys){
           Object value = node.get(key);
           if(value instanceof Ref){
               output.append(spacer).append(key).append(" -> ")
                     .append(((Ref)value).getRefPath()).append(NEWLINE);
           }
           else{
               output.append(spacer).append(key).append(NEWLINE);
           }
           if(value instanceof BranchNode){
               doCacheDumpRecursive(output,(BranchNode)value, offset +1);
           }
       }
    }

    Sample Cache Dump File

    Results

    The result of our work was that we created an efficient, coherent cache that reduced its memory footprint when compared with our previous cache component. In addition, the cache was structured in a way that was easier to maintain and extend due to an increase in clarity and a large reduction in redundant code.

    We achieved the above objectives while also reducing the time taken to parse json responses and thus speed performance of the cache was improved in most cases. Finally, we minimized our regressions by using a thorough test harness that we wrote efficiently using reflection.

    Future Improvements

    • Multiple views may be bound to the same data path so how can we notify all views when the underlying data changes? Observer pattern or RxJava.
    • Cache invalidation: We do this manually in a few specific cases now but we could implement a more holistic approach that includes expiration times for paths that can expire. Then, if that data is later requested, it is considered invalid and a remote request is again required.
    • Disk caching. It would be fairly straightforward to serialize our cache, or portions of the cache, to disk. Caching manager could then check in-memory cache, on-disk cache, and then finally go remote if needed.

    Links

    Falcor project: https://netflix.github.io/falcor/
    Netflix Releases Falcor Developer Preview: http://techblog.netflix.com/2015/08/falcor-developer-preview.html

    Evolution of Open Source at Netflix

    $
    0
    0
    When we started our Netflix Open Source (aka NetflixOSS) Program several years ago, we didn’t know how it would turn out.  We did not know whether our OSS contributions would be used, improved, or ignored; whether we’d have a community of companies and developers sending us feedback; and whether middle-tier vendors would integrate our solutions into theirs.  The reasons for starting the OSS Programs were shared previously here.


    Fast forward to today.  We have over fifty open source projects, ranging from infrastructural platform components to big data tools to deployment automation.  Over time, our OSS site became very busy with more and more components piling on.  Now, even more components are on the path to being open.


    While many of our OSS projects are being successfully used across many companies all over the world, we got a very clear signal from the community that it was getting harder to figure out which projects were useful for a particular company or a team; which were fully independent; and which were coupled together.  The external community was also unclear about which components we (Netflix) continued to invest and support, and which were in maintenance or sunset mode.  That feedback was very useful to us, as we’re committed in making our OSS Program a success.


    We recently updated our Netflix Open Source site on Github pages.  It does not yet address all of the feedback and requests we received, but we think it’s moving us in the right direction:


    1. Clear separation of categories.  Looking for Build and Delivery tools?  You shouldn’t have to wade through many unrelated projects to find them.
    2. With the new overview section of each category we can now explain in short form how each project should be used in concert with other projects.  With the old “box art” layout, it wasn’t clear how the projects fit together (or if they did) in a way that provided more value when used together.
    3. Categories now match our internal infrastructure engineering organization.  This means that the context within each category will reflect the approach to engineering within the specific technical area.  Also, we have appointed category leaders internally that will help keep each category well maintained across projects within that area.
    4. Clear highlighting of the projects we’re actively investing and supporting.  If you see the project on the site - it’s under active development and maintenance.  If you don’t see it - it may be either in maintenance only or sunset mode.  We’ll be providing more transparency on that shortly.
    5. Support for multi-repo projects.  We have several big projects that are about to be Open Sourced.  Each one will consist of many Github repos.  The old site would list each of the repos, thus making the overall navigation even less usable.  The new site allows us to group the relevant repos together under a single project


    Other feedback we’re addressing is that it was hard to get started with many of our OSS projects.  Setup / configuration was often difficult and tricky.  We’re addressing it by packaging most (not yet all) of our projects in the Docker format for easy setup.  Please note, this packaging is not intended for direct use in production, but purely for a quick ramp-up curve for understanding the open source projects.  We have found that it is far easier to help our users’ setup of our projects by running pre-built, runnable Docker containers rather than publish source code, build and setup instructions in prose on a Wiki.


    The next steps we’ll be taking in our Open Source Program:


    1. Provide full transparency on which projects are archived - i.e. no longer actively developed or maintained.  We will not be removing any code from Github repos, but will articulate if we’re no longer actively developing or using a particular project.  Netflix needs change over time, and this will affect and reflect our OSS projects.
    2. Provide a better roadmap for what new projects we are planning to open, and which Open projects are still in the state of heavy flux (evolution).  This will allow the community to better decide whether particular projects are interesting / useful.
    3. Expose some of the internal metrics we use to evaluate our OSS projects - number of issues, commits, etc.  This will provide better transparency of the maturity / velocity of each project.
    4. Documentation.  Documentation.  Documentation.


    While we’re continuing on our path to make NetflixOSS relevant and useful to many companies and developers, your continuous feedback is very important to us.  Please let us know what you think at netflixoss@netflix.com.  


    We’re planning our next NetflixOSS Meetup in early 2016 to coincide with some new and exciting projects that are about to be open.  Stay tuned and follow @netflixoss for announcements and updates.


    Netflix Hack Day - Autumn 2015

    $
    0
    0

    Last week, we hosted our latest installment of Netflix Hack Day. As always, Hack Day is a way for our product development staff to get away from everyday work, to have fun, experiment, collaborate, and be creative.

    The following video is an inside look at what our Hack Day event looks like:


    Video credit: Sean Williams

    This time, we had 75 hacks that were produced by about 200 engineers and designers (and even some from the legal team!). We’ve embedded some of our favorites below.  You can also see some of our past hacks in our posts for March 2015, Feb. 2014&Aug. 2014

    While we think these hacks are very cool and fun, they may never become part of the Netflix product, internal infrastructure, or otherwise be used beyond Hack Day.  We are posting them here publicly to simply share the spirit of the event.

    Thanks to all of the hackers for putting together some incredible work in just 24 hours!


    Netflix VHF
    Watch Netflix on your Philco Predicta, the TV of tomorrow! We converted a 1950's era TV into a smart TV that runs Netflix.


    Narcos: Plata O Plomo Video Game
    A fun game based on the Netflix original series, Narcos.


    Stream Possible
    Netflix TV experience over a 3G cell connection for the non-broadband rich parts of the world.


    Ok Netflix
    Ok Netflix can find the exact scene in a movie or episode from listening to the dialog that comes from that scene.  Speak the dialog into Ok Netflix and Ok Netflix will do the rest, starting the right title in the right location.

    Smart Channels
    A way to watch themed collections of content that are personalized and also autoplay like serialized content.


    And here are some pictures taken during the event.


    Global Continuous Delivery with Spinnaker

    $
    0
    0
    After over a year of development and production use at Netflix, we’re excited to announce that our Continuous Delivery platform, Spinnaker, is available on GitHub. Spinnaker is an open source multi-cloud Continuous Delivery platform for releasing software changes with high velocity and confidence. Spinnaker is designed with pluggability in mind; the platform aims to make it easy to extend and enhance cloud deployment models. To create a truly extensible multi-cloud platform, the Spinnaker team partnered with Google, Microsoft and Pivotal to deliver out-of-the-box cluster management and deployment. As of today, Spinnaker can deploy to and manage clusters simultaneously across both AWS and Google Cloud Platform with full feature compatibility across both cloud providers. Spinnaker also features deploys to Cloud Foundry; support for its newest addition, Microsoft Azure, is actively underway.

    If you’re familiar with Netflix’s Asgard, you’ll be in good hands. Spinnaker is the replacement for Asgard and builds upon many of its concepts.  There is no need for a migration from Asgard to Spinnaker as changes to AWS assets via Asgard are completely compatible with changes to those same assets via Spinnaker and vice versa. 


    Continuous Delivery with Spinnaker

    Spinnaker facilitates the creation of pipelines that represent a delivery process that can begin with the creation of some deployable asset (such as an machine image, Jar file, or Docker image) and end with a deployment. We looked at the ways various Netflix teams implemented continuous delivery to the cloud and generalized the building blocks of their delivery pipelines into configurable Stages that are composable into Pipelines. Pipelines can be triggered by the completion of a Jenkins Job, manually, via a cron expression, or even via other pipelines. Spinnaker comes with a number of stages, such as baking a machine image, deploying to a cloud provider, running a Jenkins Job, or manual judgement to name a few. Pipeline stages can be run in parallel or serially. 


    Spinnaker Pipelines

    Spinnaker also provides cluster management capabilities and provides deep visibility into an application’s cloud footprint. Via Spinnaker’s application view, you can resize, delete, disable, and even manually deploy new server groups using strategies like Blue-Green (or Red-Black as we call it at Netflix). You can create, edit, and destroy load balancers as well as security groups. 


    Cluster Management in Spinnaker
    Spinnaker is a collection of JVM-based services, fronted by a customizable AngularJS single-page application. The UI leverages a rich RESTful API exposed via a gateway service. 

    You can find all the code for Spinnaker on GitHubThere are also installation instructions on how to setup and deploy Spinnaker from source as well as instructions for deploying Spinnaker from pre-existing images that Kenzan and Google have created. We’ve set up a Slack channel and we are committed to leveraging StackOverflow as a means for answering community questions. Issues, questions, and pull requests are welcome. 

    Sleepy Puppy Extension for Burp Suite

    $
    0
    0
    Netflix recently open sourced Sleepy Puppy - a cross-site scripting (XSS) payload management framework for security assessments. One of the most frequently requested features for Sleepy Puppy has been for an extension for Burp Suite, an integrated platform for web application security testing. Today, we are pleased to open source a Burp extension that allows security engineers to simplify the process of injecting payloads from Sleep Puppy and then tracking the XSS propagation over longer periods of time and over multiple assessments.

    Prerequisites and Configuration
    First, you need to have a copy of Burp Suite running on your system. If you do not have a copy of Burp Suite, you can download/buy Burp Suite here. You also need a Sleepy Puppy instance running on a server. You can download Sleepy Puppy here. You can try out Sleepy Puppy using Docker. Detailed instructions on setup and configuration are available on the wiki page.

    Once you have these prerequisites taken care of, please download the Burp extension here.

    If the Sleepy Puppy server is running over HTTPS (which we would encourage), you need to inform the Burp JVM to trust the CA that signed your Sleepy Puppy server certificate. This can be done by importing the cert from Sleepy Puppy server into a keystore and then specifying the keystore location and passphrase while starting Burp Suite. Specific instructions include:


    • Visit your Sleepy Puppy server and export the certificate using Firefox in pem format
    • Import the cert in pem format into a keystore with the command below. keytool -import -file </path/to/cert.pem> -keystore sleepypuppy_truststore.jks -alias sleepypuppy
    • You can specify the truststore information for the plugin either as an environment variable or as a JVM option.
    • Set truststore info as environmental variables and start Burp as shown below: export SLEEPYPUPPY_TRUSTSTORE_LOCATION=</path/to/sleepypuppy_truststore.jks> export SLEEPYPUPPY_TRUSTSTORE_PASSWORD=<passphrase provided while creating the truststore using keytool command above> java -jar burp.jar
    • Set truststore info as part of the Burp startup command as shown below: java -DSLEEPYPUPPY_TRUSTSTORE_PASSWORD=</path/to/sleepypuppy_truststore.jks> -DSLEEPYPUPPY_TRUSTSTORE_PASSWORD=<passphrase provided while creating the truststore using keytool command above> -jar burp.jar
    Now it is time to load the Sleepy Puppy extension and explore its functionality.


    Using the Extension
    Once you launch Burp and load up the Sleepy Puppy extension, you will be presented with the Sleepy Puppy tab.


    sleepypuppy_extension.png


    This tab will allow you to leverage the capabilities of Burp Suite along with the Sleepy Puppy XSS Management framework to better manage XSS testing.


    Some of the features provided by the extension include:


    • Create a new assessment or select an existing assessment
    • Add payloads to your assessment and the Sleepy Puppy server from the the extension
    • When an Active Scan is conducted against a site or URL, the XSS payloads from the selected Sleepy Puppy Assessment will be executed after Burp's built-in XSS payloads
    • In Burp Intruder, the Sleepy Puppy Extension can be chosen as the payload generator for XSS testing
    • In Burp Repeater, you can replace any value in an existing request with a Sleepy Puppy payload using the context menu
    • The Sleepy Puppy tab provides statistics about any payloads that have been triggered for the selected assessment

    You can watch the Sleepy Puppy extension in action at youtube.

    Interested in Contributing?
    Feel free to reach out or submit pull requests if there’s anything else you’re looking for. We hope you’ll find Sleepy Puppy and the Burp extension as useful as we do!

    by: Rudra Peram
    Viewing all 303 articles
    Browse latest View live