Quantcast
Channel: Netflix TechBlog - Medium
Viewing all 303 articles
Browse latest View live

Performance without Compromise

$
0
0
Last week we hosted our latest Netflix JavaScript Talks event at our headquarters in Los Gatos, CA. We gave two talks about our unflinching stance on performance. In our first talk, Steve McGuire shared how we achieved a completely declarative, React-based architecture that’s fast on the devices in your living room. He talked about our architecture principles (no refs, no observation, no mixins or inheritance, immutable state, and top-down rendering) and the techniques we used to hit our tough performance targets. In our second talk, Ben Lesh explained what RxJS is, and why we use and love it. He shared the motivations behind a new version of RxJS and how we built it from the ground up with an eye on performance and debugging.

React.js for TV UIs


RxJS Version 5


Videos from our past talks can always be found on our Netflix UI Engineering channel on YouTube. If you’re interested in being notified of future events, just sign up on our notification list.

By Kim Trott


Global Cloud - Active-Active and Beyond

$
0
0
This is a continuing post on the Netflix architecture for Global Availability.  In the past we talked about efforts like Isthmus and Active-Active.  We continue the story from where we left off at the end of the Active-Active project in 2013.  We had achieved multi-regional resiliency for our members in the Americas, where the vast majority of Netflix members were located at the time.  Our European members, however, were still at risk from a single point of failure.
Global Cloud - Q3 2014.png
Our expansion around the world since then, has resulted in a growing percentage of international members who were exposed to this single point of failure, so we set out to make our cloud deployment even more resilient.

Creating a Global Cloud

We decided to create a global cloud where we would be able to serve requests from any member in any AWS region where we are deployed.  The diagram below shows the logical structure of our multi-region deployment and the default routing of member traffic to AWS region.
Global Cloud - Q1 2016.png

Getting There

Getting to the end state, while not disrupting our ongoing operations and the development of new features, required breaking the project down into a number of stages.  From an availability perspective, removing AWS EU-West-1 as a single point of failure was the most important goal, so we started in the Summer of 2014 by identifying the tasks that we needed to execute in order to be able to serve our European members from US-East-1.

Data Replication

When we initially launched service in Europe in 2012, we made an explicit decision to build regional data islands for most, but not all, of the member related data.  In particular, while a member’s subscription allowed them to stream anywhere that we offered service, information about what they watched while in Europe would not be merged with the information about what they watched while in the Americas.  Since we figured we would have relatively few members travelling across the Atlantic, we felt that the isolation that these data islands created was a win as it would mitigate the impact of a region specific outage.

Cassandra

In order to serve our EU members a normal experience from US-East-1, we needed to replicate the data in the EU Cassandra island data sets to the Cassandra clusters in US-East-1 and US-West-2.  We considered replicating this data into separate keyspaces in US clusters or merging the data with our Americas data.  While using separate keyspaces would have been more cost efficient, merging the datasets was more in line with our longer term goal of being able to serve any member from any region as the Americas data would be replicated to the Cassandra clusters in EU-West-1.

Merging the EU and Americas data was more complicated than the replication work that was part of the 2013 Active-Active project as we needed to examine each component data set to understand how to merge the data.  Some data sets were appropriately keyed such that the result was the union of the two island data sets.  To simplify the migration of such data sets, the Netflix Cloud Database Engineering (CDE) team enhanced the Astyanax Cassandra client to support writing to two keyspaces in parallel.  This dual write functionality was sometimes used in combination with another tool built by the CDE that could be used to forklift data from one cluster or keyspace to another.  For other data sets, such as member viewing history, custom tools were needed to handle combining the data associated with each key.  We also discovered one or two data sets in which there were unexpected inconsistencies in the data that required deeper analysis to determine which particular values to keep.

EVCache

As described in the blog post on the Active-Active project, we built a mechanism to allow updates to EVCache clusters in one region to invalidate the entry in the corresponding cluster in the other US region using an SQS message.  EVCache now supports both full replication and invalidation of data in other regions, which allows application teams to select the strategy that is most appropriate to their particular data set.  Additional details about the current EVCache architecture are available in a recent Tech Blog post.

Personalization Data

Historically the personalization data for any given member has been pre-computed in only one of our AWS regions and then replicated to whatever other regions might service requests for that member.  When a member interacted with the Netflix service in a way that was supposed to trigger an update of the recommendations, this would only happen if the interaction was serviced in the member’s “home” region, or its active-active replica, if any.

This meant that when a member was serviced from a different region during a traffic migration, their personalized information would not be updated.  Since there are regular, clock driven, updates to the precomputed data sets, this was considered acceptable for the first phase of the Global Cloud project.  In the longer term, however, the precomputation system was enhanced to allow the events that triggered recomputation to be delivered across all three regions.  This change also allowed us to redistribute the precomputation workload based on resource availability.

Handling Misrouted Traffic

In the past, Netflix has used a variety of application level mechanisms to redirect device traffic that has landed in the “wrong” AWS region, due to DNS anomalies, back to the member’s “home” region.  While these mechanisms generally worked, they were often a source of confusion due the differences in their implementations.  As we started moving towards the Global Cloud, we decided that, rather than redirecting the misrouted traffic, we would use the same Zuul-to-Zuul routing mechanism that we use when failing over traffic to another region to transparently proxy traffic from the “wrong” region to the “home” region.

As each region became capable of serving all members, we could then update the Zuul configuration to stop proxying the “misrouted” traffic to the member’s home region and simply serve it locally.  While this potentially added some latency versus sticky redirects, it allowed several teams to simplify their applications by removing the often crufty redirect code.  Application teams were given the guidance that they should no longer worry about whether a member was in the “correct” region and instead serve them the best response that they could give the locally available information.

Evolving Chaos Kong

With the Active-Active deployment model, our Chaos Kong exercises involved failing over a single region into another region.  This is also the way we did our first few Global Cloud failovers.  The following graph shows our traffic steering during a production issue in US-East-1.  We steered traffic first from US-East-1 to US-West-2 and then later in the day to EU-West-1.  The upper graph shows that the aggregate, global, stream starts tracked closely to the previous week’s pattern, despite the shifts in the amount of traffic being served by each region.  The thin light blue line shows SPS traffic for each region the previous week and allows you to see the amount of traffic we are shifting.
Cleaned up version of traffic steering during INC-1453 in mid-October.
By enhancing our traffic steering tools, we are now able to steer traffic from one region to both remaining regions to make use of available capacity.  The graphs below show a situation where we evacuated all traffic from US-East-1, sending most of the traffic to EU-West-1 and a smaller portion to US-West-2.

SPS During 2016-01-14 Failover.png
We have done similar evacuations for the other two regions, each of them involving rerouted traffic being split between both remaining regions based on available capacity and minimizing member impact.  For more details on the evolution of the Kong exercises and our Chaos philosophy behind them, see our earlier post.

Are We Done?

Not even close.  We will continue to explore new ways in which to efficiently and reliably deliver service to our millions of global members.  We will report on those experiments in future updates here.

-Peter Stout on behalf of all the teams that contributed to the Global Cloud Project

How Netflix Uses John Stamos to Optimize the Cloud at Scale

$
0
0
Netflix Technology relies heavily on the Cloud, thanks to its low latency and high compatibility with the internet.  

But the key to great Technology is having great Talent.  So when John Stamos expressed an interest in becoming more involved in our Engineering initiatives, needless to say, we were 
on Cloud Nine!


John Stamos, star of Fuller House
and world-renowned bongo player

Dreamy Results

Let’s take a look at the numbers.  Earlier this year, we were operating at a median average 
of Cloud 3.1.  We introduced Mr. Stamos into the system in early March, and in just under a month, he has helped us achieve a remarkable 290% gain.


Here’s what our architecture looks like today:

Highly Available Micro-Stamos Cloud Architecture

Personal Forecast

As a Netflix user, you may already be seeing this effect on the quality of your recommendations, which has resulted in increased overall user engagement.  For example, with the release of Fuller House, users watched an additional REDACTED million hours, and experienced an average heart rate increase of 18%.  

One might say that our personalization algorithms have a lot more personality!

Stamos-optimized home page

Lifting the Fog

How does Mr. Stamos drive these results?  

After extensive analysis and observation (mostly observation), we are certain (p=0.98) that the biggest factors are his amazing attitude and exceptionally high rate of Hearts Broken Per Second (HBPS).  

Based on these learnings, we are currently A/B testing ways to increase HBPS.  For example, which has a greater effect on the metrics: his impeccable hairstyle or his award-winning smile?  

We’ll go over our findings in a follow-up blog post, but they look fabulous so far.


Hearts Broken Per Second
HBPS: Stamos (red) vs Control (blue)

Staying Cool

Long-time readers will be familiar with our innovative Netflix Simian Army.  The best known example is Chaos Monkey, a process that tests the reliability of our services by intentionally causing failures at random.  

Thanks to Mr. Stamos, we have a new addition to the army: Style Monkey, which tests how resilient our nodes are against unexpected clothing malfunctions and bad hair days.  

As a pleasant side effect, we have noticed that the other monkeys in the Simian Army are much happier when Style Monkey is around.


The Style Monkey API

A Heavenly Future

Look for an Open Source version of our Stamos-driven Cloud architecture soon.  With contributions from the community, and by hanging out with Mr. Stamos every chance we can get, we think we can achieve Cloud 11 by late 2016.

Gosh, isn’t he great?


-The Netflix Engineering Team


The Netflix IMF Workflow

$
0
0
Following our introductory article, this (the second in our IMF series) post describes the Netflix IMF ingest implementation and how it fits within the scope of our content processing pipeline. While conventional essence containers (e.g., QuickTime) commonly include essence data in the container file, the IMF CPL is designed to contain essence by reference. As we will see soon, this has interesting architectural implications.

The Netflix Content Processing Pipeline

A simplified 3-step view of the Netflix content processing system is shown in the accompanying figure. Source files (audio, timed text or video) delivered to Netflix by content and fulfillment partners are first inspected for their correctness and conformance (the ingestion step). Examples of checks performed here include (a) data transfer sanctity checks such as file and metadata integrity, (b) compliance of source files to the Netflix delivery specification, (c) file format validation, (d) decodability of compressed bitstream, (e) “semantic” signal domain inspections, and more.

NetflixIngestionSystem.png

In summary, the ingestion step ensures that the sources delivered to Netflix are pristine and guaranteed to be usable by the distributed, cloud-scalable Netflix trans-coding engine. Following this, inspected sources are transcoded to create output elementary streams which are subsequently encrypted and packaged into streamable containers. IMF being a source format, the scope of the implementation is predominantly the first step.

IMF Ingestion: Main Concepts

An IMF ingestion workflow needs to deal with the inherent decoupling of physical assets (track files) from their playback timeline. A single track file can be applicable to multiple playback timelines and a single playback timeline can comprise portions of multiple track files. Further, physical assets and CPLs (which define the playback timelines) can be delivered at different times (via different IMPs). This design necessarily assumes that assets (CPL and track files) within a particular operational domain (in this context, an operational domain can be as small as a single mastering facility or a playback system, or as large as a planetary data service) are cataloged by an asset management service.  Such a service would provide locator translation for UUID references (i.e., to locate physical assets somewhere in a file store) as well as import/export capability from/to other operational domains.

A PKL (equivalently an IMP) defines the exchange of assets between two independent operational domains. It allows the receiving system to verify complete and error-free transmission of the intended payload without any out-of-band information. The receiving system can compare the asset references in the PKL with the local asset management service, and then initiate transfer operations on those assets not already present. In this way de-duplication is inherent to inter-domain exchange. The scope of a PKL being the specification of the inter-domain transfer, it is not expected to exist in perpetuity.  Following the transfer, asset management is the responsibility of the local asset management system at the receiver side.

The Netflix IMF Ingestion System

We have utilized the above concepts to build the Netflix IMF implementation. The accompanying figure describes our IMF ingestion workflow as a flowchart. A brief description follows:

  1. For every IMP delivered to Netflix for a specific title, we first perform transfer/delivery validations. These include but are not limited to:
    1. Checking the PKL and ASSETMAP files for correctness (while the PKL file contains a list of UUIDs corresponding to files that were a part of the delivery, the ASSETMAP file specifies the mapping of these asset identifiers (UUIDs) to locations (URIs). As an example, the ASSETMAP can contain HTTP URLs);
    2. Ensuring that checksums (actually, message digests) corresponding to files delivered via the IMP match the values provided in PKL.
    3. Track files in IMF follow the MXF (Material eXchange Format) file specification, and are mandated in the IMF context to contain a UUID value that identifies the file. The CPL schema also mandates an embedded identifier (a UUID) that uniquely identifies the CPL document. This enables us to cross-validate the list of UUIDs indicated in PKL against the files that were actually delivered as a part of the IMP.   
  2. We then perform validations on the contents of the IMP. Every CPL contained in the IMP is checked for syntactic correctness and specification compliance and every essence track file contained in the IMP is checked for syntactic as well as semantic correctness. Examples of some checks applicable to track files include:
    1. MXF file format validation;
    2. Frame-by-frame decodability of video essence bitstream;
    3. channel mapping validation for audio essence;
    4. We also collect significant descriptors such as sample rates and sample counts on these files.
Valid assets (essence track files and CPLs) are then cataloged in our asset management system.
  1. Further, upon every IMP delivery all the tracks of all the CPLs delivered against the title are checked for completeness, i.e., whether all necessary essence track files have been received and validated.
  2. Timeline inspections are then conducted against all CPL tracks that have been completed. Timeline inspections include for example:
    1. detection of digital hits in the audio timeline
    2. scene change detection in the video timeline
    3. fingerprinting of audio and video tracks

At this point, the asset management system is updated appropriately. Following the completion of the timeline inspection, the completed CPL tracks are ready to be consumed by the Netflix trans-coding engine. In summary, we follow a two-pronged approach to inspections. While one set of inspections are conducted against delivered assets every time there is a delivery, another set of inspections is triggered every time a CPL track is completed.
IMF_ingestion_flowchart.png

Asset and Timeline Management

The asset management system is tasked with tracking associations between assets and playback timelines in the context of the many-to-many mapping that exists between the two. Any failures in ingestion due to problems in source files are typically resolved by redelivery by our content partners. For various reasons, multiple CPL files could be delivered against the same playback timeline over a period of time. This makes time versioning of playback timelines and garbage collection of orphaned assets as important attributes of the Netflix asset management system. The asset management system also serves as a storehouse for all of the analysis data obtained as a result of conducting inspections.

Perceived Benefits

Incorporating IMF primitives as first class concepts in our ingestion pipeline has involved a big architectural overhaul. We believe that the following benefits of IMF have justified this undertaking:
  • reduction of several of our most frustrating content tracking issues, namely those related to “versionitis”
  • improved video quality (as we get direct access to high quality IMF masters)
  • optimizations around redeliveries, incremental changes (like new logos, content revisions, etc.), and minimized redundancy (partners deliver the “diff” between two versions of the same content)
  • metadata (e.g., channel mapping, color space information) comes in-band with physical assets, decreasing the opportunity for human error
  • granular checksums on essence (e.g., audio, video) facilitate distributed processing in the cloud

Challenges

Following is a list of challenges faced by us as we roll out our IMF ingest implementation:
  1. Legacy assets (in the content vault of content providers) as well as legacy content production workflows abound at this time. While one could argue that the latter will succumb to IMF in the medium term, the former is here to stay. The conversion of legacy assets to IMF would probably be very long drawn out. For all practical purposes, we need to work with a hybrid content ingestion workflow - one that handles both IMF and non-IMF assets. This introduces operational and maintenance complexities.
  2. Global subtitles are core to the Netflix user experience. The current lack of standardization around timed text in IMF means that we are forced to accept timed text sources outside of IMF. In fact, IMSC1 (Internet Media Subtitles and Captions 1.0) - the current contender for the IMF timed text format does not support some of the significant rendering features that are inherent to Japanese as well as some other Asian languages.  
  3. The current definition of IMF allows for version management between one IMF publisher and one IMF consumer. In the real world, multiple parties (content partners as well as fulfillment partners) could come together to produce a finished work. This necessitates a multi-party version management system (along the lines of software version control systems). While the IMF standard does not preclude this - this aspect is missing in existing IMF implementations and does not have industry mind-share as of yet.

Whats next

In our next blog post, we will describe some of the community efforts we are undertaking to help move the IMF standard and its adoption forward.


By Rohit Puri, Andy Schuler and Sreeram Chakrovorthy

Saving 13 Million Computational Minutes per Day with Flame Graphs

$
0
0
We recently uncovered a significant performance win for a key microservice here at Netflix, and we want to share the problems, challenges, and new developments for the kind of analysis that lead us to the optimization.

Optimizing performance is critical for Netflix.  Improvements enhance the customer experience by lowering latency while concurrently reducing capacity costs through increased efficiency.  Performance wins and efficiency gains can be found in many places - tuning the platform and software stack configuration, selecting different AWS instance types or features that better fit unique workloads, honing autoscaling rules, and highlighting potential code optimizations.  While many developers throughout Netflix have performance expertise, we also have a small team of performance engineers dedicated to providing the specialized tooling, methodologies, and analysis to achieve our goals.

An on-going focus for the Netflix performance team is to proactively look for optimizations in our service and infrastructure tiers.  It’s possible to save hundreds of thousands of dollars with just a few percentage points of improvement.  Given that one of our largest workloads is primarily CPU-bound, we focused on collecting and analyzing CPU profiles in that tier.  Fortunately with the work Brendan Gregg pushed forward to preserve the frame pointer in the JVM we can easily capture CPU sampling profiles using Linux perf_events on live production instances and visualize them with flame graphs:


For those unfamiliar with flame graphs, the default visualization places the initial frame in a call stack at the bottom of the graph and stacks subsequent frames on top of each other with the deepest frame at the top.  Stacks are ordered alphabetically to maximize the merging of common adjacent frames that call the same method.  As a quick side note, the magenta frames in the flame graphs are those frames that match a search phrase.  Their particular significance in these specific visualizations will be discussed later on.

Broken Stacks

Unfortunately 20% of what we see above contains broken stack traces for this specific workload.  This is due to the complex call patterns in certain frameworks that generate extremely deep stacks, far exceeding the current 127 frame limitation in Linux perf_events (PERF_MAX_STACK_DEPTH).  The long, narrow towers outlined below are the call stacks truncated as a result of this limitation:


We experimented with Java profilers to get around this stack depth limitation and were able to hack together a flame graph with just few percent of broken stacks.  In fact we captured so many unique stacks that we had to increase the minimum column width from a default 0.1 to 1 in order to generate a reasonably-sized flame graph that a browser can render.  The end result is an extremely tall flame graph of which this is only the bottom half:


Although there are still a significant number of broken stacks, we begin to see a more complete picture materialize with the full call stacks intact in most of the executing code.

Hot Spot Analysis

Without specific domain knowledge of the application code there are generally two techniques to finding potential hot spots in a CPU profile.  Based on the default stack ordering in a flame graph, a bottom-up approach starts at the base of the visualization and advances upwards to identify interesting branch points where large chunks of the sampled cost either split into multiple subsequent call paths or simply terminate at the current frame.  To maximize potential impact from an optimization, we prioritize looking at the widest candidate frames first before assessing the narrower candidates.

Using this bottom-up approach for the above flame graph, we derived the following observations:
  • Most of the lower frames in the stacks are calls executing various framework code
  • We generally find the interesting application-specific code in the upper portion of the stacks
  • Sampled costs have whittled down to just a few percentage points at most by the time we reach the interesting code in the thicker towers
While it’s still worthwhile to pursue optimizing some of these costs, this visualization doesn’t point to any obvious hot spot.

Top-Down Approach

The second technique is a top-down approach where we visualize the sampled call stacks aggregated in reverse order starting from the leaves.  This visualization is simple to generate with Brendan’s flame graph script using the options --inverted --reverse, which merges call stacks top-down and inverts the layout.  Instead of a flame graph, the visualization becomes an icicle graph.  Here are the same stacks from the previous flame graph reprocessed with those options:


In this approach we start at the top-most frames again prioritizing the wider frames over the more narrow ones.  An icicle graph can surface some obvious methods that are called excessively or are by themselves computationally expensive.  Similarly it can help highlight common code executed in multiple unique call paths.

Analyzing the icicle graph above, the widest frames point to map get/put calls.  Some of the other thicker columns that stand out are related to a known inefficiency within one of the frameworks utilized.  However, this visualization still doesn’t illustrate any specific code path that may produce a major win.

A Middle-Out Approach

Since we didn’t find any obvious hotspots from the bottom-up and top-down approaches, we thought about how to improve our focus on just the application-specific code.  We began by reprocessing the stack traces to collapse the repetitive framework calls that constitute most of the content in the tall stacks.  As we iterated through removing the uninteresting frames, we saw some towers in the flame graph coalescing around a specific application package.

Remember those magenta-colored frames in the images above?  Those frames match the package name we uncovered in this exercise.  While it’s somewhat arduous to visualize the package’s cost because the matching frames are scattered throughout different towers, the flame graph's embedded search functionality attributed more than 30% of the samples to the matching package.

This cost was obscured in the flame graphs above because the matching frames are split across multiple towers and appear at different stack depths.  Similarly, the icicle graph didn’t fare any better because the matching frames diverge into different call paths that extend to varying stack heights.  These factors defeat the merging of common frames in both visualizations for the bottom-up and top-down approaches because there isn’t a common, consolidated pathway to the costly code.  We needed a new way to tackle this problem.

Given the discovery of the potentially expensive package above, we filtered out all the frames in each call stack until we reached a method calling this package.  It’s important to clarify that we are not simply discarding non-matching stacks.  Rather, we are reshaping the existing stack traces in different and better ways around the frames of interest to facilitate stack merging in the flame graph.  Also, to keep the matching stack cost in context within the overall sampled cost, we truncated the non-matching stacks to merge into an “OTHER” frame.  The resulting flame graph below reveals that the matching stacks account for almost 44% of CPU samples, and we now have a high degree of clarity of the costs within the package:


To explain how the matching cost jumped from 30% to 44% between the original flame graphs and the current one, we recall that earlier we needed to increase the column minimum width from 0.1 to 1 in the unfiltered flame graph.  That surprisingly removed almost a third of the matching stack traces, which further highlights how the call patterns dispersed the package's cost across the profile.  Not only have we simplified and consolidated the visualization for the package through reshaping the stack traces, but we have also improved the precision when accounting for its costs.

Hitting the Jackpot

Once we had this consolidated visualization, we began unraveling the application logic executing the call stack in the main tower.  Reviewing this flame graph with the feature owners, it was quickly apparent that a method call into legacy functionality accounted for an unexpectedly large proportion of the profiled cost.  The flame graph above highlights the suspect method in magenta and shows it matching 25% of CPU samples.  As luck would have it, a dynamic flag already existed that gates the execution of this method.  After validating that the method no longer returns distinct results, the code path was disabled in a canary cluster resulting in a dramatic drop in CPU usage and request latencies:


Capturing a new flame graph further illustrates the savings with the package’s cost decreasing to 18% of CPU samples and the unnecessary method call now matching just a fraction of a percent:


Quantifying the actual CPU savings, we calculated that this optimization reduces the service's computation time by more than 13 million minutes (or almost 25 years) of CPU time per day.

Looking Forward

Aggregating costs based on a filter is admittedly not a new concept.  The novelty of what we’ve done here is to maximize the merging of interesting frames through the use of variable stack trace filters within a flame graph visualization.

In the future we’d like to be able to define ad hoc inclusion or exclusion filters in a full flame graph to dynamically update a visualization into a more focused flame graph such as the one above.  It will also be useful to apply inclusion filters in reverse stack order to visualize the call stacks leading into matching frames.  In the meantime, we are exploring ways to intelligently generate filtered flame graphs to help teams visualize the cost of their code running within shared platforms.

Our goal as a performance team is to help scale not only the company by also our own capabilities. To achieve this we look to develop new approaches and tools for others at Netflix to consume in a self-service fashion. The flame graph work in this post is part of a profiling platform we have been building that can generate on-demand CPU flame graphs for Java and Node.js applications and is available 24x7 across all services. We'll be using this platform for automated regression analysis as well to push actionable data directly to engineering teams. Lots of exciting and new work in this space is coming up.

A Scalable System for Ingestion and Delivery of Timed Text

$
0
0
Offering the same great Netflix experience to diverse audiences and cultures around the world is a core aspect of the global Netflix video delivery service. With high quality subtitle localization being a key component of the experience, we have developed (and are continuously refining) a Unicode standard based i18n-grade timed text processing pipeline.  This pipeline allows us to meet the challenges of scale brought by the global Netflix platform as well as features unique to each script and language. In this article, we provide a description of this timed text processing pipeline at Netflix including factors and insights that shaped its architecture.  

Timed Text At Netflix: Overview

As described above, Timed Text - subtitles, Closed Captions (CC), and Subtitles for Deaf and Hard of Hearing (SDH) - is a core component of the Netflix experience.  A simplified view of the Netflix timed text processing pipeline is shown in the accompanying figure. Every timed text source delivered to Netflix by a content provider or a fulfillment partner goes through the following major steps before showing up on the Netflix service:  

2.png

  • Ingestion: The first step involves delivery of the authored timed text asset to Netflix. Once a transfer has been completed,  data is verified for any transport corruption and corresponding metadata is duly verified. Examples of such metadata include (but are not limited to) associated movie title and primary language of timed text source.
  • Inspection: The ingested asset is then subject to a rigorous set of automated checks to identify any authoring errors. These errors fall mostly into two categories, namely specification conformance and style compliance. Following sections give out more details on types and stages of these inspections.
  • Conversion: An error free inspected file, is then considered good for generating output files to support the device ecosystem. Netflix needs to host different output versions of the ingested asset to satisfy varying device capabilities in the field.

As the number of regions, devices and file formats grow, we must accommodate the ever growing requirements on the system. We have responded to these challenges by designing an i18n grade Unicode-based pipeline. Let’s look at these individual components in next sections.

Inspection: What’s In Timed Text?

The core information communicated in a timed text file corresponds to text translation of what is being spoken on screen along with the associated active time intervals. In addition, timed text files might carry positional information (e.g., to indicate who might be speaking or to place rendered text in a non-active area of the screen) as well as any associated text styles such as color (e.g., to distinguish speakers), italics etc. Readers who are familiar with HTML and CSS web technologies, might understand timed text to provide similar but lightweight way of formatting text data with layouts and style information.

Source Formats

Multiple formats for authoring timed text have evolved over time and across regions, each with different capabilities. Based on factors including the extent of standardization as well as the availability of authored sources, Netflix predominantly accepts the following timed text formats:

  • CEA-608 based Scenarist Closed Captions (.scc)
  • EBU Subtitling data exchange format (.stl)
  • TTML (.ttml, .dfxp, .xml)
  • Lambda Cap (.cap) (for Japanese language only)

An approximate distribution of timed text sources delivered to Netflix is depicted below. Given our experience with the broadcast lineage (.scc and .stl) as well as regional source formats (.cap), we prefer delivery in the TTML (Timed Text Markup Language) format. While formats like .scc and .stl have limited language support (e.g., both do not include Asian character set), .cap and .scc are ambiguous from a specification point of view. As an example, .scc files use drop frame timecode syntax to indicate 23.976 fps (frames per second) - however this was defined only for the NTSC 29.97 frame rate in SMPTE (Society of Motion Picture and Television Engineers). As a result, the proportion of TTML-based subtitles in our catalog is on the rise.

3.png

The Inspections Pipeline

Let’s now see how timed text files are inspected through the Netflix TimedText Processing Pipeline. Control-flow wise, given a source file, the appropriate parser performs source-specific inspections to ensure file adheres to the purported specification.  The source is then converted to a common canonical format where semantic inspections are performed (An example of such an inspection is to check if timed text events would collide spatially when rendered. More examples are shown in the adjoining figure).

4.png

Given many possible character encodings (e.g., UTF-8, UTF-16, Shift-JIS), the first step is to detect the most probable charset. This information is used by the appropriate parser to parse the source file. Most parsing errors are fatal in nature resulting in termination of the inspection processing which is followed by a redelivery request to the content partner.

Semantic checks that are common to all formats are performed in ISD (Intermediate Synchronic Document) based canonical domain. Parsed objects from various sources generate ISD sequences on which more analysis is carried out. An ISD representation can be thought of as a decomposition of the subtitle timeline into a sequence of time intervals such that within each such interval the rendered subtitle matter stays the same (see adjacent figure). These snapshots include style and positional information during that interval and are completely isolated from other events in the sequence. This makes for a great model for running concurrent inspections as well. Following diagram better depicts how ISD format can be visualized.

5.png
Stylistic and language specific checks are performed on this data. An example of a canonical check is counting the number of active lines on the screen at any point in time. Some of these checks may be fatal, others may trigger a human-review-required warning and allow the source to continue down the workflow.

Another class of inspections are built around Unicode recommendations. Unicode TR-9, which specifies Unicode Bidirectional (BiDi) Algorithm, is used to check if a file with bi-directional text conforms to the specification and the final display ordered output would make sense (Bidirectional text is common in languages such as Arabic and Hebrew where the displayed text matter runs from right to left and numbers and text in other languages runs from left to right). Normalization rules (TR-15), may have to be applied to check glyph conformance and rendering viability before these assets could be accepted.

Language based checks are an interesting study. Take, for example, character limits. A sentence that is too long will force wrapping or line breaks. This ignores authoring intent and compromises rendering aesthetics. The actual limit will vary between languages (think Arabic versus Japanese). If enforcing reading speed, those character limits must also account for display time. For these reasons, canonical inspections must be highly configurable and pluggable.

Output Profiles: Why We Convert

While source formats for timed text are designed for the purpose of archiving, delivery formats are designed to be nimble so as to facilitate streaming and playback in bandwidth, CPU and memory constrained environments. To achieve this objective, we convert all timed text sources to the following family of formats:

  • TTML Based Output profiles
  • WebVTT Based Output profiles
  • Image Subtitles

After a source file passes inspection, the ISD-based canonical representation is saved in cloud storage. This forms the starting point for the conversion step.  First, a set of broad filters that are applicable to all output profiles are applied. Then, models for corresponding standards (TTML, WebVTT) are generated. We continue to filter down based on output profile and language. From there, it’s simply a matter of writing and storing the downloadables. The following figure describes conversion modules and output profiles in the Netflix TimedText Processing Pipeline.
6.png

Multiple profiles within a family of formats may be required. Depending on the capabilities on the devices, the TTML set, for example, has been divided into further following profiles:
  • simple-sdh: Supports only text and timing information. This profile doesn’t support any positional information and is expected to be consumed by the most resource-limited devices.
  • ls-sdh: Abbreviated from less-simple sdh, it supports a richer variety of text styles and positional data on top of simple-sdh. The simple-sdh and ls-sdh serve the Pan-European and American geography and use the WGL4 (Windows Glyph List 4) character repertoire.
  • ntflx-ttml-gsdh: This is the latest addition to the TTML family. It supports a broad range of Unicode code-points as well as language features like Bidi, rubies, etc. Following text snippets show vertical writing mode with ruby and “tate-chu-yoko” features.
7.png
When a Netflix user activates subtitles, the device requests a specific profile based on its capabilities. Devices with enough RAM (and a good connection) might download the ls-sdh file. Resource-limited devices may ask for the smaller simple-sdh file.
8.png
Additionally, certain language features (like Japanese rubies and boutens) may require advanced rendering capabilities not available on all devices. To support this, image profile pre-renders subtitles as images in the cloud and transmits them to end-devices using a progressive transfer model. The WebVTT family of output profiles is primarily used by the Apple iOS platform. The accompanying pie chart shows a share on how these output profiles are being consumed.

QC: How Does it Look?

We have automated (or are working towards) a number of quality related measurements: these include spelling checks, text to audio sync, text overlapping burned-in text, reading speed limits, characters per line, total lines per screen. While such metrics go a long way towards improving quality of subtitles, they are by no means enough to guarantee a flawless user experience.
There are times when rendered subtitle text might occlude an important visual element, or subtitle translations from one language to another can result in an unidiomatic experience. Other times there could be intentional misspellings or onomatopoeia - we still need to rely on human eyes and human ears to judge subtitling quality in such cases. A lot of work remains to achieve full QC automation.

Netflix and the Community

Given the significance of subtitles to the Netflix business, Netflix has been actively involved in timed text standardization forums such as W3C TTWG (Timed Text Working Group). IMSC1 (Internet Media Subtitles and Captions) is a TTML-based specification that addresses some of the limitations encountered in existing source formats. Further, it has been deemed as mandatory for IMF (Interoperable Master Format). Netflix is 100% committed to IMF and we expect that our ingest implementation will support the text profile of IMSC. To that end, we have been actively involved in moving the IMSC1 specification forward. Multiple Netflix sponsored implementations for IMSC1 were announced to TTWG in February 2016 paving the way for the specification to move to recommendation status.

IMSC1 does not have support for essential features (e.g., rubies) for rendering Japanese and other Asian subtitles. To accelerate that effort we are actively involved in standardization of TTML2 - both from a specification and as well as an implementation perspective. Our objective is to get to TTML2-based IMSC2.

Examples of OSS (open source software) projects sponsored by Netflix in this context include “ttt” (Timed Text Toolkit). This project offers tools for validation and rendering of W3C TTML family of formats (e.g., TTML1, IMSC1, and TTML2). “Photon” is an example of a project developed internally at Netflix. The objective of Photon is to provide the complete set of tools for validation of IMF packages.

The role of Netflix in advancing subtitle standards in the industry has been recognized by The National Academy of Television Arts & Sciences, and Netflix was a co-recipient of the 2015 Technology and Engineering Emmy Award for “Standardization and Pioneering Development of Non-Live Broadcast Captioning”.

Future Work

In a closed system such as the Netflix playback system, where the generation and consumption of timed text delivery formats can be controlled, it is possible to have a firm grip on the end-to-end system. Further, the streaming player industry has moved to support leading formats. However, support on the ingestion side remains tricky. New markets can introduce new formats with new features.

Consider right-to-left languages. The bidirectional (bidi) algorithm has gone through many revisions. Many tools still in use were developed to old versions of the bidi specification. As these files are passed to newer tools with newer bidi implementations, chaos ensues.

Old but popular formats like SCC and STL were developed for broadcast frame rates. When conformed to film content, they fall outside the scope of the original intent. Following chart shows the distribution of these sources as delivered to Netflix. More than 60% of our broadcast-minded assets have been conformed to film content.

9.png

Such challenges generate ever increasing requirements on inspection routines. Thrash requires operational support to manage communication across teams for triage/redelivery. One idea to solve these overheads could be to offer inspections as a web service (see accompanying figure).

In such a model, a partner uploads their timed text file(s), inspections are run, and a common format file(s) is returned. This common format will be an open standard like TTML. The service also provides a preview of how the text will be rendered. In case an error has been found, we can show the partner where the error is and suggest recommendations to fix it.

Not only will this model reduce the frequency of software maintenance and enhancement, but will drastically cut down the need for manual intervention. It also provides an opportunity for our content partners who could integrate this capability into their authoring workflow and iteratively improve the quality of the authored subtitles.


10.png

Timed text assets carry a lot of untapped potential. For example, timed text files may contain object references in dialogue. Words used in a context could provide more information about possible facial expressions or actions on the screen. Machine learning and natural language processing may help solve labor-intensive QC challenges. Data mining into the timed text could even help automate movie ratings. As media consumption becomes more global, timed text sources will explode in number and importance. Developing a system that scales and learns over time is the demand of the hour.


By Shinjan Tiwary, Dae Kim, Harold Sutherland, Rohit Puri and David Ronca

Kafka Inside Keystone Pipeline

$
0
0

This is the second blog of our Keystone pipeline series. Please refer to the first part for overview and evolution of the Keystone pipeline. In summary, the Keystone pipeline is a unified event publishing, collection, and routing infrastructure for both batch and stream processing.


We have two sets of Kafka clusters in Keystone pipeline: Fronting Kafka and Consumer Kafka. Fronting Kafka clusters are responsible for getting the messages from the producers which are virtually every application instance in Netflix. Their roles are data collection and buffering for downstream systems. Consumer Kafka clusters contain a subset of topics routed by Samza for real-time consumers.

We currently operate 36 Kafka clusters consisting of 4,000+ broker instances for both Fronting Kafka and Consumer Kafka. More than 700 billion messages are ingested on an average day. We are currently transitioning from Kafka version 0.8.2.1 to 0.9.0.1.

Design Principles

Given the current Kafka architecture and our huge data volume, to achieve lossless delivery for our data pipeline is cost prohibitive in AWS EC2. Accounting for this, we’ve worked with teams that depend upon our infrastructure to arrive at an acceptable amount of data loss, while balancing cost.  We’ve achieved a daily data loss rate of less than 0.01%. Metrics are gathered for dropped messages so we can take action if needed.

The Keystone pipeline produces messages asynchronously without blocking applications. In case a message cannot be delivered after retries, it will be dropped by the producer to ensure the availability of the application and good user experience. This is why we have chosen the following configuration for our producer and broker:

  • acks = 1
  • block.on.buffer.full = false
  • unclean.leader.election.enable = true
Most of the applications in Netflix use our Java client library to produce to Keystone pipeline. On each instance of those applications, there are multiple Kafka producers, with each producing to a Fronting Kafka cluster for sink level isolation. The producers have flexible topic routing and sink configuration which are driven via dynamic configuration that can be changed at runtime without having to restart the application process. This makes it possible for things like redirecting traffic and migrating topics across Kafka clusters. For non-Java applications, they can choose to send events to Keystone REST endpoints which relay messages to fronting Kafka clusters.

For greater flexibility, the producers do not use keyed messages. Approximate message ordering is re-established in the batch processing layer (Hive / Elasticsearch) or routing layer for streaming consumers.

We put the stability of our Fronting Kafka clusters at a high priority because they are the gateway for message injection. Therefore we do not allow client applications to directly consume from them to make sure they have predictable load.

Challenges of running Kafka in the Cloud

Kafka was developed with data center as the deployment target at LinkedIn. We have made notable efforts to make Kafka run better in the cloud.

In the cloud, instances have an unpredictable life-cycle and can be terminated at anytime due to hardware issues. Transient networking issues are expected. These are not problems for stateless services but pose a big challenge for a stateful service requiring ZooKeeper and a single controller for coordination.

Most of our issues begin with outlier brokers. An outlier may be caused by uneven workload, hardware problems or its specific environment, for example, noisy neighbors due to multi-tenancy. An outlier broker may have slow responses to requests or frequent TCP timeouts/retransmissions. Producers who send events to such a broker will have a good chance to exhaust their local buffers while waiting for responses, after which message drop becomes a certainty. The other contributing factor to buffer exhaustion is that Kafka 0.8.2 producer doesn’t support timeout for messages waiting in buffer.

Kafka’s replication improves availability. However, replication leads to inter-dependencies among brokers where an outlier can cause cascading effect. If an outlier slows down replication, replication lag may build up and eventually cause partition leaders to read from the disk to serve the replication requests. This slows down the affected brokers and eventually results in producers dropping messages due to exhausted buffer as explained in previous case.

During our early days of operating Kafka, we experienced an incident where producers were dropping a significant amount of messages to a Kafka cluster with hundreds of instances due to a ZooKeeper issue while there was little we could do. Debugging issues like this in a small time window with hundreds of brokers is simply not realistic.

Following the incident, efforts were made to reduce the statefulness and complexity for our Kafka clusters, detect outliers, and find a way to quickly start over with a clean state when an incident occurs.

Kafka Deployment Strategy

The following are the key strategies we used for deploying Kafka clusters

  • Favor multiple small Kafka clusters as opposed to one giant cluster. This reduces the operational complexity for each cluster. Our largest cluster has less than 200 brokers.
  • Limit the number of partitions in each cluster. Each cluster has less than 10,000 partitions. This improves the availability and reduces the latency for requests/responses that are bound to the number of partitions.
  • Strive for even distribution of replicas for each topic. Even workload is easier for capacity planning and detection of outliers.
  • Use dedicated ZooKeeper cluster for each Kafka cluster to reduce the impact of ZooKeeper issues.

The following table shows our deployment configurations.


Fronting Kafka Clusters
Consumer Kafka Clusters
Number of clusters
24
12
Total number of instances
3,000+
900+
Instance type
d2.xl
i2.2xl
Replication factor
2
2
Retention period
8 to 24 hours
2 to 4 hours

Kafka Failover

We automated a process where we can failover both producer and consumer (router) traffic to a new Kafka cluster when the primary cluster is in trouble. For each fronting Kafka cluster, there is a cold standby cluster with desired launch configuration but minimal initial capacity. To guarantee a clean state to start with, the failover cluster has no topics created and does not share the ZooKeeper cluster with the primary Kafka cluster. The failover cluster is also designed to have replication factor 1 so that it will be free from any replication issues the original cluster may have.

When failover happens, the following steps are taken to divert the producer and consumer traffic:

  • Resize the failover cluster to desired size.
  • Create topics on and launch routing jobs for the failover cluster in parallel.
  • (Optionally) Wait for leaders of partitions to be established by the controller to minimize the initial message drop when producing to it.
  • Dynamically change the producer configuration to switch producer traffic to the failover cluster.

The failover scenario can be depicted by the following chart:
With the complete automation of the process, we can do failover in less than 5 minutes. Once failover has completed successfully, we can debug the issues with the original cluster using logs and metrics. It is also possible to completely destroy the cluster and rebuild with new images before we switch back the traffic. In fact, we often use failover strategy to divert the traffic while doing offline maintenance. This is how we are upgrading our Kafka clusters to new Kafka version without having to do the rolling upgrade or setting the inter-broker communication protocol version.

Development for Kafka

We developed quite a lot of useful tools for Kafka. Here are some of the highlights:

Producer sticky partitioner

This is a special customized partitioner we have developed for our Java producer library. As the name suggests, it sticks to a certain partition for producing for a configurable amount of time before randomly choosing the next partition. We found that using sticky partitioner together with lingering helps to improve message batching and reduce the load for the broker. Here is the table to show the effect of the sticky partitioner:


partitioner
batched records
per request
broker cpu utilization [1]
random without lingering
1.25
75%
sticky without lingering
2.0
50%
sticky with 100ms lingering
15
33%

[1] With an load of 10,000 msgs / second per broker and 1KB per message

Rack aware replica assignment

All of our Kafka clusters spans across three AWS availability zones. An AWS availability zone is conceptually a rack. To ensure availability in case one zone goes down, we developed the rack (zone) aware replica assignment so that replicas for the same topic are assigned to different zones. This not only helps to reduce the risk of a zone outage, but also improves our availability when multiple brokers co-located in the same physical host are terminated due to host problems. In this case, we have better fault tolerance than Kafka’s N - 1 where N is the replication factor.

The work is contributed to Kafka community in KIP-36 and Apache Kafka Github Pull Request #132.

Kafka Metadata Visualizer

Kafka’s metadata is stored in ZooKeeper. However, the tree view provided by Exhibitor is difficult to navigate and it is time consuming to find and correlate information.

We created our own UI to visualize the metadata. It provides both chart and tabular views and uses rich color schemes to indicate ISR state. The key features are the following:

  • Individual tab for views for brokers, topics, and clusters
  • Most information is sortable and searchable
  • Searching for topics across clusters
  • Direct mapping from broker ID to AWS instance ID
  • Correlation of brokers by the leader-follower relationship

The following are the screenshots of the UI:


Monitoring

We created a dedicated monitoring service for Kafka. It is responsible for tracking:

  • Broker status (specifically, if it is offline from ZooKeeper)
  • Broker’s ability to receive messages from producers and deliver messages to consumers. The monitoring service acts as both producer and consumer for continuous heartbeat messages and measures the latency of these messages.
  • For old ZooKeeper based consumers, it monitors the partition count for the consumer group to make sure each partition is consumed.
  • For Keystone Samza routers, it monitors the checkpointed offsets and compares with broker’s log offsets to make sure they are not stuck and have no significant lag.

In addition, we have extensive dashboards to monitor traffic flow down to a topic level and most of the broker’s  metrics.

Future plan

We are currently in process of migrating to Kafka 0.9, which has quite a few features we want to use including new consumer APIs, producer message timeout and quotas. We will also move our Kafka clusters to AWS VPC and believe its improved networking (compared to EC2 classic) will give us an edge to improve availability and resource utilization.

We are going to introduce a tiered SLA for topics. For topics that can accept minor loss, we are considering using one replica. Without replication, we not only save huge on bandwidth, but also minimize the state changes that have to depend on the controller. This is another step to make Kafka less stateful in an environment that favors stateless services. The downside is the potential message loss when a broker goes away. However, by leveraging the producer message timeout in 0.9 release and possibly AWS EBS volume, we can mitigate the loss.

Stay tuned for future Keystone blogs on our routing infrastructure, container management, stream processing and more!
By Real-Time Data Infrastructure Team
Allen Wang,Steven Wu,Monal Daxini,Manas Alekar,Zhenzhong Xu,Jigish Patel,Nagarjun Guraja,Jonathan Bond,Matt Zimmer,Peter Bakas,Kunal Kundaje

It’s All A/Bout Testing: The Netflix Experimentation Platform

$
0
0

Ever wonder how Netflix serves a great streaming experience with high-quality video and minimal playback interruptions? Thank the team of engineers and data scientists who constantly A/B test their innovations to our adaptive streaming and content delivery network algorithms. What about more obvious changes, such as the complete redesign of our UI layout or ournew personalized homepage? Yes, all thoroughly A/B tested.


In fact, every product change Netflix considers goes through a rigorous A/B testing process before becoming the default user experience. Major redesigns like the ones above greatly improve our service by allowing members to find the content they want to watch faster. However, they are too risky to roll out without extensive A/B testing, which enables us to prove that the new experience is preferred over the old.
And if you ever wonder whether we really set out to test everything possible, consider that even the images associated with many titles are A/B tested, sometimes resulting in20% to 30% more viewing for that title!

Results like these highlight why we are so obsessed with A/B testing. By following an empirical approach, we ensure that product changes are not driven by the most opinionated and vocal Netflix employees, but instead by actual data, allowing our members themselves to guide us toward the experiences they love.

In this post we’re going to discuss the Experimentation Platform: the service which makes it possible for every Netflix engineering team to implement their A/B tests with the support of a specialized engineering team. We’ll start by setting some high level context around A/B testing before covering the architecture of our current platform and how other services interact with it to bring an A/B test to life.

Overview

The general concept behind A/B testing is to create an experiment with a control group and one or more experimental groups (called “cells” within Netflix) which receive alternative treatments. Each member belongs exclusively to one cell within a given experiment, with one of the cells always designated the “default cell”. This cell represents the control group, which receives the same experience as all Netflix members not in the test. As soon as the test is live, we track specific metrics of importance, typically (but not always) streaming hours and retention. Once we have enough participants to draw statistically meaningful conclusions, we can get a read on the efficacy of each test cell and hopefully find a winner.

From the participant’s point of view, each member is usually part of several A/B tests at any given time, provided that none of those tests conflict with one another (i.e. two tests which modify the same area of a Netflix App in different ways). To help test owners track down potentially conflicting tests, we provide them with a test schedule view in ABlaze, the front end to our platform. This tool lets them filter tests across different dimensions to find other tests which may impact an area similar to their own.

Screen Shot 2016-04-16 at 11.30.36 AM.png
There is one more topic to address before we dive further into details, and that is how members get allocated to a given test. We support two primary forms of allocation: batch and real-time.

Batch allocations give analysts the ultimate flexibility, allowing them to populate tests using custom queries as simple or complex as required. These queries resolve to a fixed and known set of members which are then added to the test. The main cons of this approach are that it lacks the ability to allocate brand new customers and cannot allocate based on real-time user behavior. And while the number of members allocated is known, one cannot guarantee that all allocated members will experience the test (e.g. if we’re testing a new feature on an iPhone, we cannot be certain that each allocated member will access Netflix on an iPhone while the test is active).

Real-Time allocations provide analysts with the ability to configure rules which are evaluated as the user interacts with Netflix. Eligible users are allocated to the test in real-time if they meet the criteria specified in the rules and are not currently in a conflicting test. As a result, this approach tackles the weaknesses inherent with the batch approach. The primary downside to real-time allocation, however, is that the calling app incurs additional latencies waiting for allocation results. Fortunately we can often run this call in parallel while the app is waiting on other information. A secondary issue with real-time allocation is that it is difficult to estimate how long it will take for the desired number of members to get allocated to a test, information which analysts need in order to determine how soon they can evaluate the results of a test.

A Typical A/B Test Workflow

With that background, we’re ready to dive deeper. The typical workflow involved in calling the Experimentation Platform (referred to as A/B in the diagrams for shorthand) is best explained using the following workflow for an Image Selection test. Note that there are nuances to the diagram below which I do not address in depth, in particular the architecture of the Netflix API layer which acts as a gateway between external Netflix apps and internal services.

In this example, we’re running a hypothetical A/B test with the purpose of finding the image which results in the greatest number of members watching a specific title. Each cell represents a candidate image. In the diagram we’re also assuming a call flow from a Netflix App running on a PS4, although the same flow is valid for most of our Device Apps.

Screen Shot 2016-04-29 at 7.42.46 AM.png
  1. The Netflix PS4 App calls the Netflix API. As part of this call, it delivers a JSON payload containing session level information related to the user and their device.
  2. The call is processed in a script written by the PS4 App team. This script runs in the Client Adaptor Layer of the Netflix API, where each Client App team adds scripts relevant to their app. Each of these scripts come complete with their own distinct REST endpoints. This allows the Netflix API to own functionality common to most apps, while giving each app control over logic specific to them. The PS4 App Script now calls the A/B Client, a library our team maintains, and which is packaged within the Netflix API. This library allows for communication with our backend servers as well as other internal Netflix services.
  3. The A/B Client calls a set of other services to gather additional context about the member and the device.
  4. The A/B Client then calls the A/B Server for evaluation, passing along all the context available to it.
  5. In the evaluation phase:
    1. The A/B Server retrieves all test/cell combinations to which this member is already allocated.
    2. For tests utilizing the batch allocation approach, the allocations are already known at this stage.
    3. For tests utilizing real-time allocation, the A/B Server evaluates the context to see if the member should be allocated to any additional tests. If so, they are allocated.
    4. Once all evaluations and allocations are complete, the A/B Server passes the complete set of tests and cells to the A/B Client, which in turn passes them to the PS4 App Script. Note that the PS4 App has no idea if the user has been in a given test for weeks or the last few microseconds. It doesn’t need to know or care about this.
  6. Given the test/cell combinations returned to it, the PS4 App Script now acts on any tests applicable to the current client request. In our example, it will use this information to select the appropriate piece of art associated with the title it needs to display, which is returned by the service which owns this title metadata. Note that the Experimentation Platform does not actually control this behavior: doing so is up to the service which actually implements each experience within a given test.
  7. The PS4 App Script (through the Netflix API) tells the PS4 App which image to display, along with all the other operations the PS4 App must conduct in order to correctly render the UI.

Now that we understand the call flow, let’s take a closer look at that box labelled “A/B Server”.

The Experimentation Platform

Screen Shot 2016-04-29 at 6.58.44 AM.png
The allocation and retrieval requests described in the previous section pass through REST API endpoints to our server. Test metadata pertaining to each test, including allocation rules, are stored in a Cassandra data store. It is these allocation rules which are compared to context passed from the A/B Client in order to determine a member’s eligibility to participate in a test (e.g. is this user in Australia, on a PS4, and has never previously used this version of the PS4 app).

Member allocations are also persisted in Cassandra, fronted by a caching layer in the form of an EVCache cluster, which serves to reduce the number of direct calls to Cassandra. When an app makes a request for current allocations, the AB Client first checks EVCache for allocation records pertaining to this member. If this information was previously requested within the last 3 hours (the TTL for our cache), a copy of the allocations will be returned from EVCache. If not, the AB Server makes a direct call to Cassandra, passing the allocations back to the AB Client, while simultaneously populating them in EVCache.

When allocations to an A/B test occur, we need to decide the cell in which to place each member. This step must be handled carefully, since the populations in each cell should be as homogeneous as possible in order to draw statistically meaningful conclusions from the test. Homogeneity is measured with respect to a set of key dimensions, of which country and device type (i.e. smart TV, game console, etc.) are the most prominent. Consequently, our goal is to make sure each cell contains similar proportions of members from each country, using similar proportions of each device type, etc. Purely random sampling can bias test results by, for instance, allocating more Australian game console users in one cell versus another. To mitigate this issue we employ a sampling method called stratified sampling, which aims to maintain homogeneity across the aforementioned key dimensions. There is a fair amount of complexity to our implementation of stratified sampling, which we plan to share in a future blog post.

In the final step of the allocation process, we persist allocation details in Cassandra and invalidate the A/B caches associated with this member. As a result, the next time we receive a request for allocations pertaining to this member, we will experience a cache miss and execute the cache related steps described above.

We also simultaneously publish allocation events to a Kafka data pipeline, which feeds into several data stores. The feed published to Hive tables provides a source of data for ad-hoc analysis, as well as Ignite, Netflix’s internal A/B Testing visualization and analysis tool. It is within Ignite that test owners analyze metrics of interest and evaluate the results of a test. Once again, you should expect an upcoming blog post focused on Ignite in the near future.

The latest updates to our tech stack added Spark Streaming, which ingests and transforms data from Kafka streams before persisting them in ElasticSearch, allowing us to display near real-time updates in ABlaze. Our current use cases involve simple metrics, allowing users to view test allocations in real-time across dimensions of interest. However, these additions have laid the foundation for much more sophisticated real-time analysis in the near future.

Upcoming Work

The architecture we’ve described here has worked well for us thus far. We continue to support an ever-widening set of domains: UI, Recommendations, Playback, Search, Email, Registration, and many more. Through auto-scaling we easily handle our platform’s typical traffic, which ranges from 150K to 450K requests per second. From a responsiveness standpoint, latencies fetching existing allocations range from an average of 8ms when our cache is cold to < 1ms when the cache is warm. Real-time evaluations take a bit longer, with an average latency around 50ms.

However, as our member base continues to expand globally, the speed and variety of A/B testing is growing rapidly. For some background, the general architecture we just described has been around since 2010 (with some obvious exceptions such as Kafka). Since then:

  • Netflix has grown from streaming in 2 countries to 190+
  • We’ve gone from 10+ million members to 80+ million
  • We went from dozens of devices to thousands, many with their own Netflix app

International expansion is part of the reason we’re seeing an increase in device types. In particular, there is an increase in the number of mobile devices used to stream Netflix. In this arena, we rely on batch allocations, as our current real-time allocation approach simply doesn’t work: the bandwidth on mobile devices is not reliable enough for an app to wait on us before deciding which experience to serve… all while the user is impatiently staring at a loading screen.

Additionally, some new areas of innovation conduct A/B testing on much shorter time horizons than before. Tests focused on UI changes, recommendation algorithms, etc. often run for weeks before clear effects on user behavior can be measured. However the adaptive streaming tests mentioned at the beginning of this post are conducted in a matter of hours, with internal users requiring immediate turn around time on results.

As a result, there are several aspects of our architecture which we are planning to revamp significantly. For example, while the real-time allocation mechanism allows for granular control, evaluations need to be faster and must interact more effectively with mobile devices.

We also plan to leverage the data flowing through Spark Streaming to begin forecasting per-test allocation rates given allocation rules. The goal is to address the second major drawback of the real-time allocation approach, which is an inability to foresee how much time is required to get enough members allocated to the test. Giving analysts the ability to predict allocation rates will allow for more accurate planning and coordination of tests.
These are just a couple of our upcoming challenges. If you’re simply curious to learn more about how we tackle them, stay tuned for upcoming blog posts. However, if the idea of solving these challenges and helping us build the next generation of Netflix’s Experimentation platform excites you, we’re always looking for talented engineers to join our team!


Selecting the best artwork for videos through A/B testing

$
0
0
At Netflix, we are constantly looking at ways to help our 81.5M members discover great stories that they will love.  A big part of that is creating a user experience that is intuitive, fun, and meaningfully helps members find and enjoy stories on Netflix as fast as possible.  


This blog post and the corresponding non-technical blog by my Creative Services colleague Nick Nelson take a deeper look at the key findings from our work in image selection -- focusing on how we learned, how we improved the service and how we are constantly developing new technologies to make Netflix better for our members.

Gone in 90 seconds

Broadly, we know that if you don’t capture a member’s attention within 90 seconds, that member will likely lose interest and move onto another activity. Such failed sessions could at times be because we did not show the right content or because we did show the right content but did not provide sufficient evidence as to why our member should watch it. How can we make it easy for our members to evaluate if a piece of content is of interest to them quickly?  


As the old saying goes, a picture is worth a thousand words.  Neuroscientists have discovered that the human brain can process an image in as little as 13 milliseconds, and that across the board, it takes much longer to process text compared to visual information.  Will we be able to improve the experience by improving the images we display in the Netflix experience?


This blog post sheds light on the groundbreaking series of A/B tests Netflix did which resulted in increased member engagement.  Our goals were the following:
  1. Identify artwork that enabled members to find a story they wanted to watch faster.
  2. Ensure that our members increase engagement with each title and also watch more in aggregate.
  3. Ensure that we don’t misrepresent titles as we evaluate multiple images.  


The series of tests we ran is not unlike any other area of the product -- where we relentlessly test our way to a better member experience with an increasingly complex set of hypotheses using the insights we have gained along the way.

Background and motivation

When a typical member comes to the above homepage the member glances at several details for each title including the display artwork (e.g. highlighted “Narcos” artwork in the “Popular on Netflix” row), title (“Narcos”), movie ratings (TV-MA), synopsis, star rating, etc. Through various studies, we found that our members look at the artwork first and then decide whether to look at additional details.  Knowing that, we asked ourselves if we could improve the click-through rate for that first glance?  To answer this question, we sought the support of our Creative Services team who work on creating compelling pieces of artwork that convey the emotion of the entire title in a single image, while staying true to the spirit.  The Creative Services team worked with our studio partners and at times with our internal design team to create multiple artwork variants.


Examples of artwork that were used in other contexts that don’t naturally lend themselves to be used on the Netflix service.


Historically, this was a largely unexplored area at Netflix and in the industry in general.  Netflix would get title images from our studio partners that were originally created for a variety of purposes. Some were intended for roadside billboards where they don’t live alongside other titles.  Other images were sourced from DVD cover art which don’t work well in a grid layout in multiple form factors (TV, mobile, etc.).  Knowing that, we set out to develop a data driven framework through which we can find the best artwork for each video, both in the context of the Netflix experience and with the goal of increasing overall engagement -- not just move engagement from one title to another.

Testing our way into a better product

Broadly, Netflix’s A/B testing philosophy is about building incrementally, using data to drive decisions, and failing fast.  When we have a complex area of testing such as image selection, we seek to prove out the hypothesis in incremental steps with increasing rigor and sophistication.


Experiment 1 (single title test with multiple test cells)


One of the earliest tests we ran was on the single title “The Short Game” - an inspiring story about several grade school students competing with each other in the game of golf.   If you see the default artwork for this title you might not realize easily that it is about kids and skip right past it.  Could we create a few artwork variants that increase the audience for a title?


Cells
Cell 1 (Control)
Cell 2
Cell 3
Box Art
Default artwork
14% better take rate
6% better take rate


To answer this question, we built a very simple A/B test where members in each test cell get a different image for that title.  We measured the engagement with the title for each variant - click through rate, aggregate play duration, fraction of plays with short duration, fraction of content viewed (how far did you get through a movie or series), etc.  Sure enough, we saw that we could widen the audience and increase engagement by using different artwork.


A skeptic might say that we may have simply moved hours to this title from other titles on the service.  However, it was an early signal that members are sensitive to artwork changes.  It was also a signal that there were better ways we could help our members find the types of stories they were looking for within the Netflix experience. Knowing this, we embarked on an incrementally larger test to see if we could build a similar positive effect on a larger set of titles.  

Experiment 2 (multi-cell explore-exploit test)

The next experiment ran with a significantly larger set of titles across the popularity spectrum - both blockbusters and niche titles.  The hypothesis for this test was that we can improve aggregate streaming hours for a large member allocation by selecting the best artwork across each of these titles.  


This test was constructed as a two part explore-exploit test.  The “explore” test measured engagement of each candidate artwork for a set of titles.  The “exploit” test served the most engaging artwork (from explore test) for future users and see if we can improve aggregate streaming hours.


Explore test cells
Control cell
Explore Cell 1
Explore Cell 2
Explore cell 3

Serve default artwork for all titles
Serve artwork variant 1 for all titles
Serve artwork variant 2 for all titles
Serve artwork variant 3 for all titles
Measure best artwork variant for each title over 35 days and feed the exploit test.


Exploit test cells
Control cell
Exploit Cell 1
Exploit Cell 2
Exploit cell 3

Serve default artwork for the title
Serve winning artwork for the title based on metric 1
Serve winning artwork for the title based on metric 2
Serve winning artwork for the title based on metric 3
Compare by cell the “Total streaming hours” and “Hour share of the titles we tested”


Using the explore member population, we measured the take rate (click-through rate) of all artwork variants for each title.  We computed take rate by dividing number of plays (barring very short plays) by the number of impressions on the device.  We had several choices for the take rate metric across different grains:
  • Should we include members who watch a few minutes of a title, or just those who watched an entire episode, or those who watched the entire show?
  • Should we aggregate take rate at the country level, region level, or across global population?


Using offline modeling, we narrowed our choices to 3 different take rate metrics using a combination of the above factors.  Here is a pictorial summary of how the two tests were connected.


The results from this test were unambiguous - we significantly raised view share of the titles testing multiple variants of the artwork and we were also able to raise aggregate streaming hours.  It proved that we weren't simply shifting hours.  Showing members more relevant artwork drove them to watch more of something they have not discovered earlier.  We also verified that we did not negatively affect secondary metrics like short duration plays, fraction of content viewed, etc.  We did additional longitudinal A/B tests over many months to ensure that simply changing artwork periodically is not as good as finding a better performing artwork and demonstrated the gains don’t just come from changing the artwork.


There were engineering challenges as we pursued this test.  We had to invest in two major areas - collecting impression data consistently across devices at scale and across time.


1. Client side impression tracking:  One of the key components to measuring take rate is knowing how often a title image came into the viewport on the device (impressions).  This meant that every major device platform needed to track every image that came into the viewport when a member stopped to consider it even for a fraction of a second.  Every one of these micro-events is compacted and sent periodically as a part of the member session data.  Every device should consistently measure impressions even though scrolling on an iPad is very different than the navigation on a TV.  We collect billions of such impressions daily with low loss rate across every stage in the network - a low storage device might evict events before successfully sending them, lossiness on the network, etc.


2. Stable identifiers for each artwork:  An area that was surprisingly challenging was creating stable unique ids for each artwork.  Our Creative Services team steadily makes changes to the artwork - changing title treatment, touching up to improve quality, sourcing higher resolution artwork, etc.  
house-of-cards-blog-details.png
The above diagram shows the anatomy of the artwork - it contains the background image, a localized title treatment in most languages we support, an optional ‘new episode’ badge, and a Netflix logo for any of our original content.


These two images have different aspect ratios and localized title treatments but have the same lineage ID.


So, we created a system that automatically grouped artwork that had different aspect ratios, crops, touch ups, localized title treatments but had the same background image.  Images that share the same background image were associated with the same “lineage ID”.


Even as Creative Services changed the title treatment and the crop, we logged the data using the lineage ID of the artwork.  Our algorithms can combine data from our global member base even as their preferred locale varied.  This improved our data particularly in smaller countries and less common languages.

Experiment 3 (single cell title level explore test)

While the earlier experiment was successful, there are faster and more equitable ways to learn the performance of an artwork.  We wish to impose on the fewest number of randomly selected members for the least amount of time before we can confidently determine the best artwork for every title on the service.  


Experiment 2 pre-allocated each title into several equal sized cells -- one per artwork variant. We potentially wasted impressions because every image, including known under-performing ones, continue to get impressions for many days.  Also, based on the allocation size, say 2 million members, we would accurately detect performance of images for popular titles but not for niche titles due to sample size.  If we allocated a lot more members, say 20 million members, then we would accurately learn performance of artwork for niche titles but we would be over exposing poor performing artwork of the popular titles.


Experiment 2 did not handle dynamic changes to the number of images that needed evaluation.  i.e. we could not evaluate 10 images for a popular title while evaluating just 2 for another.


We tried to address all of these limitations in the design for a new “title level explore test”.  In this new experiment, all members of the explore population are in a single cell.  We dynamically assign an artwork variant for every (member, title) pair just before the title gets shown to the member.  In essence, we are performing the A/B test for every title with a cell for each artwork.  Since the allocation happens at the title level, we are now able to accommodate different number of artwork variants per title.


This new test design allowed us to get results even faster than experiment 2 since the first N members, say 1 million, who see a title could be used to evaluate performance of its image variants.  We continue to stay in explore phase as long as it takes for us to determine a significant winner -- typically a few days.  After that, we exploit the win and all members enjoy the benefit by seeing the winning artwork.


Here are some screenshots from the tool that we use to track relative artwork performance.
Dragons: Race to the Edge: the two marked images below significantly outperformed all others.

Conclusion

Over the course of this series of tests, we have found many interesting trends among the winning images as detailed in this blog post.  Images that have expressive facial emotion that conveys the tone of the title do particularly well.  Our framework needs to account for the fact that winning images might be quite different in various parts of the world.  Artwork featuring recognizable or polarizing characters from the title tend to do well.  Selecting the best artwork has improved the Netflix product experience in material ways.  We were able to help our members find and enjoy titles faster.


We are far from done when it comes to improving artwork selection.  We have several dimensions along which we continue to experiment.  Can we move beyond artwork and optimize across all asset types (artwork, motion billboards, trailers, montages, etc.)  and choose between the best asset types for a title on a single canvas?


This project brought together the many strengths of Netflix including a deep partnership between best-in-class engineering teams, our Creative Services design team, and our studio partners.  If you are interested in joining us on such exciting pursuits, then please look at our open job descriptions around product innovation and machine learning.


(on behalf of the teams that collaborated)

Highlights from PRS2016 workshop

$
0
0
Personalized recommendations and search are the primary ways Netflix members find great content to watch. We’ve written much about how we build them and some of the open challenges. Recently we organized a full-day workshop at Netflix on Personalization, Recommendation and Search (PRS2016), bringing together researchers and practitioners in these three domains. It was a forum to exchange information, challenges and practices, as well as strengthen bridges between these communities. Seven invited speakers from the industry and academia covered a broad range of topics, highlighted below. We look forward to hearing more and continuing the fascinating conversations at PRS2017!


Semantic Entity Search, Maarten de Rijke, University of Amsterdam

Entities, such as people, products, organizations, are the ingredients around which most conversations are built. A very large fraction of the queries submitted to search engines revolve around entities. No wonder that the information retrieval community continues to devote a lot of attention to entity search. In this talk Maarten discussed recent advances in entity retrieval. Most of the talk was focused on unsupervised semantic matching methods for entities that are able to learn from raw textual evidence associated with entities alone. Maarten then pointed out challenges (and partial solutions) to learn such representations in a dynamic setting and to learn to improve such representations using interaction data.


Combining matrix factorization and LDA topic modeling for rating prediction and learning user interest profiles, Deborah Donato, StumbleUpon

Matrix Factorization through Latent Dirichlet Allocation (fLDA) is a generative model for concurrent rating prediction and topic/persona extraction. It learns topic structure of URLs and topic affinity vectors for users, and predicts ratings as well. The fLDA model achieves several goals for StumbleUpon in a single framework: it allows for unsupervised inference of latent topics in the URLs served to users and for users to be represented as mixtures over the same topics learned from the URLs (in the form of affinity vectors generated by the model). Deborah presented an ongoing effort inspired by the fLDA framework devoted to extend the original approach to an industrial environment. The current implementation uses a (much faster) expectation maximization method for parameter estimation, instead of Gibbs sampling as in the original work and implements a modified version of in which topic distributions are learned independently using LDA prior to training the main model. This is an ongoing effort but Deborah presented very interesting results.


Exploiting User Relationships to Accurately Predict Preferences in Large Scale Networks, Jennifer Neville, Purdue University

The popularity of social networks and social media has increased the amount of information available about users' behavior online--including current activities and interactions among friends and family. This rich relational information can be used to predict user interests and preferences even when individual data is sparse, since the characteristics of friends are often correlated. Although relational data offer several opportunities to improve predictions about users, the characteristics of online social network data also present a number of challenges to accurately incorporate the network information into machine learning systems. This talk outlined some of the algorithmic and statistical challenges that arise due to partially-observed, large-scale networks, and describe methods for semi-supervised learning and active exploration that address the challenges.


Why would you recommend me THAT!?, Aish Fenton, Netflix

With so many advances in machine learning recently, it’s not unreasonable to ask: why aren’t my recommendations perfect by now? Aish provided a walkthrough of the open problems in the area of recommender systems, especially as they apply to Netflix’s personalization and recommendation algorithms. He also provided a brief overview of recommender systems, and sketched out some tentative solutions for the problems he presented.


Diversity in Radio, David Ross, Google

Many services offer streaming radio stations seeded by an artist or song, but what does that mean? To get specific, what fraction of the songs in “Taylor Swift Radio” should be by Taylor Swift? David provided a short introduction to the YouTube Radio project, and dived into the diversity problem, sharing some insights Google has learned from live experiments and human evaluations.


Immersive Recommendation Using Personal Digital Traces, Deborah Estrin and Andy Hsieh, Cornell Tech

From topics referred to in Twitter or email, to web browser histories, to videos watched and products purchased online, our digital traces (small data) reflect who we are, what we do, and what we are interested in. In this talk, Deborah and Andy presented a new user-centric recommendation model, called Immersive Recommendation, that incorporate cross-platform, diverse personal digital traces into recommendations. They discussed techniques that infer users' interests from personal digital traces while suppressing context-specified noise replete in these traces, and propose a hybrid collaborative filtering algorithm to fuse the user interests with content and rating information to achieve superior recommendation performance throughout a user's lifetime, including in cold-start situations. They illustrated this idea with personalized news and local event recommendations. Finally they discussed future research directions and applications that incorporate richer multimodal user-generated data into recommendations, and the potential benefits of turning such systems into tools for awareness and aspiration.


Response prediction for display advertising, Olivier Chapelle, Criteo (paper)

Click-through and conversion rates estimation are two core predictions tasks in display advertising. Olivier presented a machine learning framework based on logistic regression that is specifically designed to tackle the specifics of display advertising. The resulting system has the following characteristics: it is easy to implement and deploy; it is highly scalable (they have trained it on terabytes of data); and it provides models with state-of-the-art accuracy. Olivier described how the system uses explore/exploit machinery to constantly vary and evolve its predictive model on live streaming data.

We hope you find these presentations stimulating. We certainly did, and look forward to organizing similar events in the future! If you’d like to help us tackle challenges in these areas, to help our members find great stories to enjoy, checkout our job postings.

Building High-Performance Mobile Applications at Netflix

$
0
0
On April 21, we hosted our first Mobile event at Netflix with two talks focusing on the challenges we’ve faced building performant mobile experiences, and how we addressed them.

Francois Goldfain, Engineering Manager for the Android Platform team, kicked off the event with his talk on optimizing the Netflix Android app.  Francois shared insights into how we’ve made the most of the limited memory, network, and battery resources available on Android devices, and shared some of the mobile engineering best practices we built into our application and why we did them.

For the second talk - Shiva Garlapati, Senior Software Engineer on the Android Innovation team, and Lawrence Jones, Senior UI Engineering on the Originals UI team, gave a joint talk sharing their experiences building smooth animations on Android and iOS, respectively.  They spoke about the challenges they faced as well as the best practices they used to overcome them across the wide range of devices we support.

Optimizing Netflix for Android


Smooth Animations on Android


Smooth Animations on iOS


These talks and many others from past Netflix Engineering events can be found on our YouTube channel.    

By Maxine Cheung

Netflix Hack Day - Spring 2016

$
0
0


Keeping with our roughly six-month cadence, Netflix recently hosted another fantastic Hack Day event.  As was the case with our past installments, Hack Day is a way for our product development staff to take a break from everyday work to have fun, experiment with new technologies, collaborate with new people, and to generally be creative.

This time, we were lucky to have a team of Netflixers emerge to hack together a documentary video of the event.  The following provides a peek into how the event operates:

We had an excellent turnout, including over 200 engineers and designers working on more than 80 hacks.  The hacks themselves ranged from product ideas to internal tools to improvements in our recruiting process. We’ve embedded videos below, produced by the hackers, to some of our favorites. You can also see more hacks from several of our past events: November 2015, March 2015,Feb. 2014&Aug. 2014.

As always, while we think these hacks are very cool and fun, they may never become part of the Netflix product, internal infrastructure, or otherwise be used beyond Hack Day.  We are posting them here publicly to simply share the spirit of the event and our culture of innovation.

Thanks to all of the hackers for putting together some incredible work!


Netflix Zone
An alternate Netflix viewing experience created for the HTC Vive (VR). You just crossed over into...the Netflix Zone.

Spinnacraft
Integration of our open-source continuous delivery platform, Spinnaker, with Minecraft. Enough said.

Tetris
Wish your recently watched row did not fall down from the top of your row list? Want to add other rows that we are not displaying to you yet? Presenting a desktop Netflix experience with drag and drop repositionable rows, pinned rows, and add/remove rows.
Family Catch-up Viewing
See what your other profiles are watching in the player so you can know exactly where they left off in the episode. Now there’s no excuse to (accidentally) watch ahead!
By Lyle Troxell

QuietCast
You want to watch Marvel's Daredevil on your Cast TV or Chromecast, but you just put your kid to bed in the next room. No problem, you plug in your headphones on your android tablet and cast the show. The audio plays from your phone while the cast target plays the video in silence.
By Kevin Morris, Baskar Odayarkoil and Shaomei Chen


Application data caching using SSDs

$
0
0

The Moneta project: Next generation EVCache for better cost optimization

With the global expansion of Netflix earlier this year came the global expansion of data. After the Active-Active project and now with the N+1 architecture, the latest personalization data needs to be everywhere at all times to serve any member from any region. Caching plays a critical role in the persistence story for member personalization as detailed in this earlier blog post.


There are two primary components to the Netflix architecture. The first is the control plane that runs on the AWS cloud for generic, scalable computing for member signup, browsing and playback experiences. The second is the data plane, called Open Connect, which is our global video delivery network. This blog is about how we are bringing the power and economy of SSDs to EVCache - the primary caching system in use at Netflix for applications running in the control plane on AWS.


One of the main use cases of EVCache is to act as globally replicated storage for personalized data for each of our more than 81 million members. EVCache plays a variety of roles inside Netflix besides holding this data, including acting as a standard working-set cache for things like subscriber information. But its largest role is for personalization. Serving anyone from anywhere means that we must hold all of the personalized data for every member in each of the three regions that we operate in. This enables a consistent experience in all AWS regions and allows us to easily shift traffic during regional outages or during regular traffic shaping exercises to balance load. We have spoken at length about the replication system used to make this happen in a previous blog post.


During steady state, our regions tend to see the same members over and over again. Switching between regions is not a very common phenomenon for our members. Even though their data is in RAM in all three regions, only one region is being used regularly per member. Extrapolating from this, we can see that each region has a different working set for these types of caches. A small subset is hot data and the rest is cold.


Besides the hot/cold data separation, the cost of holding all of this data in memory is growing along with our member base. As well, different A/B tests and other internal changes can add even more data. For our working set of members, we have billions of keys already and that number will only grow. We have the challenge of continuing to support Netflix use cases while balancing cost. To meet this challenge, we are introducing a multi-level caching scheme using both RAM and SSDs.


The EVCache project to take advantage of this global request distribution and cost optimization is called Moneta, named for the Latin Goddess of Memory, and Juno Moneta, the Protectress of Funds for Juno.


Current Architecture

We will talk about the current architecture of the EVCache servers and then talk about how this is evolving to enable SSD support.


The picture below shows a typical deployment for EVCache and the relationship between a single client instance and the servers. A client of EVCache will connect to several clusters of EVCache servers. In a region we have multiple copies of the whole dataset, separated by AWS Availability Zone. The dashed boxes delineate the in-region replicas, each of which has a full copy of the data and acts as a unit. We manage these copies as separate AWS Auto Scaling groups. Some caches have 2 copies per region, and some have many. This high level architecture is still valid for us for the foreseeable future and is not changing. Each client connects to all of the servers in all zones in their own region. Writes are sent to all copies and reads prefer topologically close servers for read requests. To see more detail about the EVCache architecture, see our original announcement blog post.


Client - Server architecture.png


The server as it has evolved over the past few years is a collection of a few processes, with two main ones: stock Memcached, a popular and battle tested in-memory key-value store, and Prana, the Netflix sidecar process. Prana is the server's hook into the rest of Netflix's ecosystem, which is still primarily Java-based. Clients connect directly to the Memcached process running on each server. The servers are independent and do not communicate with one another.


Old Server Closeup.png

Optimization

As one of the largest subsystems of the Netflix cloud, we're in a unique position to apply optimizations across a significant percentage of our cloud footprint. The cost of holding all of the cached data in memory is growing along with our member base. The output of a single stage of a single day's personalization batch process can load more than 5 terabytes of data into its dedicated EVCache cluster. The cost of storing this data is multiplied by the number of global copies of data that we store. As mentioned earlier, different A/B tests and other internal changes can add even more data. For just our working set of members, we have many billions of keys today, and that number will only grow.


To take advantage of the different data access patterns that we observe in different regions, we built a system to store the hot data in RAM and cold data on disk. This is a classic two-level caching architecture (where L1 is RAM and L2 is disk), however engineers within Netflix have come to rely on the consistent, low-latency performance of EVCache. Our requirements were to be as low latency as possible, use a more balanced amount of (expensive) RAM, and take advantage of lower-cost SSD storage while still delivering the low latency our clients expect.


In-memory EVCache clusters run on the AWS r3 family of instance types, which are optimized for large memory footprints. By moving to the i2 family of instances, we gain access to 10 times the amount of fast SSD storage as we had on the r3 family (80 → 800GB from r3.xlarge to i2.xlarge) with the equivalent RAM and CPU. We also downgraded instance sizes to a smaller amount of memory. Combining these two, we have a potential of substantial cost optimization across our many thousands of servers.

Moneta architecture

The Moneta project introduces two new processes to the EVCache server: Rend and Mnemonic. Rend is a high-performance proxy written in Go with Netflix use cases as the primary driver for development. Mnemonic is a disk-backed key-value store based on RocksDB. Mnemonic reuses the Rend server components that handle protocol parsing (for speaking the Memcached protocols), connection management, and parallel locking (for correctness). All three servers actually speak the Memcached text and binary protocols, so client interactions between any of the three have the same semantics. We use this to our advantage when debugging or doing consistency checking.


New Server Closeup.png


Where clients previously connected to Memcached directly, they now connect to Rend. From there, Rend will take care of the L1/L2 interactions between Memcached and Mnemonic. Even on servers that do not use Mnemonic, Rend still provides valuable server-side metrics that we could not previously get from Memcached, such as server-side request latencies. The latency introduced by Rend, in conjunction with Memcached only, averages only a few dozen microseconds.


As a part of this redesign, we could have integrated the three processes together. We chose to have three independent processes running on each server to maintain separation of concerns. This setup affords better data durability on the server. If Rend crashes, the data is still intact in Memcached and Mnemonic. The server is able to serve customer requests once they reconnect to a resurrected Rend process. If Memcached crashes, we lose the working set but the data in L2 (Mnemonic) is still available. Once the data is requested again, it will be back in the hot set and served as it was before. If Mnemonic crashes, it wouldn't lose all the data, but only possibly a small set that was written very recently. Even if it did lose the data, at least we have the hot data still in RAM and available for those users who are actually using the service. This resiliency to crashes is on top of the resiliency measures in the EVCache client.

Rend

Rend, as mentioned above, acts as a proxy in front of the two other processes on the server that actually store the data. It is a high-performance server that speaks the binary and text Memcached protocols. It is written in Go and relies heavily on goroutines and other language primitives to handle concurrency. The project is fully open source and available on Github. The decision to use Go was deliberate, because we needed something that had lower latency than Java (where garbage collection pauses are an issue) and is more productive for developers than C, while also handling tens of thousands of client connections. Go fits this space well.


Rend has the responsibility of managing the relationship between the L1 and L2 caches on the box. It has a couple of different policies internally that apply to different use cases. It also has a feature to cut data into fixed size chunks as the data is being inserted into Memcached to avoid pathological behavior of the memory allocation scheme inside Memcached. This server-side chunking is replacing our client-side version, and is already showing promise. So far, it's twice as fast for reads and up to 30 times faster for writes. Fortunately, Memcached, as of 1.4.25, has become much more resilient to the bad client behavior that caused problems before. We may drop the chunking feature in the future as we can depend on L2 to have the data if it is evicted from L1.

Design

The design of Rend is modular to allow for configurable functionality. Internally, there are a few layers: Connection management, a server loop, protocol-specific code, request orchestration, and backend handlers. To the side is a custom metrics package that enables Prana, our sidecar, to poll for metrics information while not being too intrusive. Rend also comes with a testing client library that has a separate code base. This has helped immensely in finding protocol bugs or other errors such as misalignment, unflushed buffers, and unfinished responses.


Rend Internals.png


Rend's design allows different backends to be plugged in with the fulfillment of an interface and a constructor function. To prove this design out, an engineer familiar with the code base took less than a day to learn LMDB and integrate it as a storage backend. The code for this experiment can be found at https://github.com/Netflix/rend-lmdb.

Usage in Production

For the caches that Moneta serves best, there are a couple of different classes of clients that a single server serves. One class is online traffic in the hot path, requesting personalization data for a visiting member. The other is traffic from the offline and nearline systems that produce personalization data. These typically run in large batches overnight and continually write for hours on end.


The modularity allows our default implementation to optimize for our nightly batch compute by inserting data into L2 directly and smartly replacing hot data in L1, rather than letting those writes blow away our L1 cache during the nightly precompute. The replicated data coming from other regions can also be inserted directly into L2, since data replicated from another region is unlikely to be “hot” in its destination region. The diagram below shows the multiple open ports in one Rend process that both connect to the backing stores. With the modularity of Rend, it was easy to introduce another server on a different port for batch and replication traffic with only a couple more lines of code.


Rend Ports.png

Performance

Rend itself is very high throughput. While testing Rend separately, we consistently hit network bandwidth or packet processing limits before maxing CPU. A single server, for requests that do not need to hit the backing store, has been driven to 2.86 million requests per second. This is a raw, but unrealistic, number. With Memcached as the only backing storage, Rend can sustain 225k inserts per second and 200k reads per second simultaneously on the largest instance we tested. An i2.xlarge instance configured to use both L1 and L2 (memory and disk) and data chunking, which is used as a standard instance for our production clusters, can perform 22k inserts per second (with sets only), 21k reads per second (with gets only), and roughly 10k sets and 10k gets per second if both are done simultaneously. These are lower bounds for our production traffic, because the test load consisted of random keys thus affording no data locality benefits during access. Real traffic will hit the L1 cache much more frequently than random keys do.


As a server-side application, Rend unlocks all kinds of future possibilities for intelligence on the EVCache server. Also, the underlying storage is completely disconnected from the protocol used to communicate. Depending on Netflix needs, we could move L2 storage off-box, replace the L1 Memcached with another store, or change the server logic to add global locking or consistency. These aren't planned projects, but they are possible now that we have custom code running on the server.

Mnemonic

Mnemonic is our RocksDB-based L2 solution. It stores data on disk. The protocol parsing, connection management, and concurrency control of Mnemonic are all managed by the same libraries that power Rend. Mnemonic is another backend that is plugged into a Rend server. The native libraries in the Mnemonic project expose a custom C API that is consumed by a Rend handler.
Mnemonic stack.png


The interesting parts of Mnemonic are in the C++ core layer that wraps RocksDB. Mnemonic handles the Memcached-style requests, implementing each of the needed operations to conform to Memcached behavior, including TTL support. It includes one more important feature: it shards requests across multiple RocksDB databases on a local system to reduce the work for each individual instance of RocksDB. The reasons why will be explored in the next section.

RocksDB

After looking at some options for efficiently accessing SSDs, we picked RocksDB, an embedded key-value store which uses a Log Structured Merge Tree data structure design. Write operations are first inserted into a in-memory data structure (a memtable) that is flushed to disk when full. When flushed to disk, the memtable becomes an immutable SST file. This makes most writes sequential to the SSD, which reduces the amount of internal garbage collection that the SSD must perform and thus improve latency on long running instances while also reducing wear.


One type of work that is done in the background by each separate instance of RocksDB includes compaction. We initially used the Level style compaction configuration, which was the main reason to shard the requests across multiple databases. However, while we were evaluating this compaction configuration with production data and production-like traffic, we found that compaction was causing a great deal of extra read/write traffic to the SSD, increasing latencies past what we found acceptable. The SSD read traffic surpassed 200MB/sec at times. Our evaluation traffic included a prolonged period where the number of write operations was high, simulating daily batch compute processes. During that period, RocksDB was constantly moving new L0 records into the higher levels, causing a very high write amplification.


To avoid this overhead, we switched to FIFO style compaction. In this configuration, no real compaction operation is done. Old SST files are deleted based on the maximum size of the database. Records stay on disk in level 0, so the records are only ordered by time across the multiple SST files. The downside of this configuration is that a read operation must check each SST file in reverse chronological order before a key is determined to be missing. This check does not usually require a disk read, as the RocksDB bloom filters prevent a high percentage of the queries from requiring a disk access on each SST. However, the number of SST files causes the overall effectiveness of the set of bloom filters to be less than the normal Level style compaction. The initial sharding of the incoming read and write requests across the multiple RocksDB instances helps lessen the negative impact of scanning so many files.

Performance

Re-running our evaluation test again with the final compaction configuration, we are able to achieve a 99th percentile latency of ~9ms for read queries during our precompute load. After the precompute load completed, the 99th percentile read latency reduced to ~600μs on the same level of read traffic. All of these tests were run without Memcached and without RocksDB block caching.


To allow this solution to work with more varied uses, we will need to reduce the number of SST files that needs to be checked per query. We are exploring options like RocksDB’s Universal style compaction or our own custom compaction where we could better control the compaction rate thereby lowering the amount of data transferred to and from the SSD.

Conclusion

We are rolling out our solution in phases in production. Rend is currently in production serving some of our most important personalization data sets. Early numbers show faster operations with increased reliability, as we are less prone to temporary network problems. We are in the process of deploying the Mnemonic (L2) backend to our early adopters. While we're still in the process of tuning the system, the results look promising with the potential for substantial cost savings while still allowing the ease of use and speed that EVCache has always afforded its users.


It has been quite a journey to production deployment, and there's still much to do: deploy widely, monitor, optimize, rinse and repeat. The new architecture for EVCache Server is allowing us to continue to innovate in ways that matter. If you want to help solve this or similar big problems in cloud architecture, join us.


Meson: Workflow Orchestration for Netflix Recommendations

$
0
0
At Netflix, our goal is to predict what you want to watch before you watch it. To do this, we run a large number of machine learning (ML) workflows every day. In order to support the creation of these workflows and make efficient use of resources, we created Meson.


Meson is a general purpose workflow orchestration and scheduling framework that we built to manage ML pipelines that execute workloads across heterogeneous systems. It manages the lifecycle of several ML pipelines that build, train and validate personalization algorithms that drive video recommendations.


One of the primary goals of Meson is to increase the velocity, reliability and repeatability of algorithmic experiments while allowing engineers to use the technology of their choice for each of the steps themselves.

Powering Machine Learning Pipelines

Spark, MLlib, Python, R and Docker play an important role in several current generation machine learning pipelines within Netflix.


Let’s take a look at a typical machine learning pipeline that drives video recommendations and how it is represented and handled in Meson.


(click to enlarge)


The workflow involves:
  • Selecting a set of users - This is done via a Hive query to select the cohort for analysis
  • Cleansing / preparing the data - A Python script that creates 2 sets of users for ensuring parallel paths
  • In the parallel paths, one uses Spark to build and analyze a global model with HDFS as temporary storage.
    The other uses R to build region (country) specific models. The number of regions is dynamic based on the cohort selected for analysis. The Build Regional Model and Validate Regional Model steps in the diagram are repeated for each region (country), expanded at runtime and executed with different set of parameters as shown below
  • Validation - Scala code that tests for the stability of the models when the two paths converge. In this step we also go back and repeat the whole process if the model is not stable.
  • Publish the new model - Fire off a Docker container to publish the new model to be picked up by other production systems


(click to enlarge)


The above picture shows a run in progress for the workflow described above
  • The user set selection, and cleansing of the data has been completed as indicated by the steps in green.
  • The parallel paths are in progress
    • The Spark branch has completed the model generation and the validation
    • The for-each branch has kicked off 4 different regional models and all of them are in progress (Yellow)
  • The Scala step for model selection is activated (Blue). This indicates that one or more of the incoming branches have completed, but it is still not scheduled for execution because there are incoming branches that have either (a) not started or (b) are in progress
  • Runtime context and parameters are passed along the workflow for business decisions

Under the Hood

Let’s dive behind the scenes to understand how Meson orchestrates across disparate systems and look at the interplay within different components of the ecosystem. Workflows have a varying set of resource requirements and expectations on total run time. We rely on resource managers like Apache Mesos to satisfy these requirements. Mesos provides task isolation and excellent abstraction of CPU, memory, storage, and other compute resources. Meson leverages these features to achieve scale and fault tolerance for its tasks.


Meson Scheduler
Meson scheduler, which is registered as a Mesos framework, manages the launch, flow control and runtime of the various workflows. Meson delegates the actual resource scheduling to Mesos. Various requirements including memory and CPU are passed along to Mesos. While we do rely on Mesos for resource scheduling, the scheduler is designed to be pluggable, should one choose to use another framework for resource scheduling.


Once a step is ready to be scheduled, the Meson scheduler chooses the right resource offer from Mesos and ships off the task to the Mesos master.

Meson Executor

The Meson executor is a custom Mesos executor. Writing a custom executor allows us to  maintain a communication channel with Meson. This is especially useful for long running tasks where framework messages can be sent to the Meson scheduler. This also enables us to pass custom data that’s richer than just exit codes or status messages.


Once Mesos schedules a Meson task, it launches a Meson executor on a slave after downloading all task dependencies. While the core task is being executed, the executor does housekeeping chores like sending heartbeats, percent complete, status messages etc.

DSL

Meson offers a Scala based DSL that allows for easy authoring of workflows. This makes it very easy for developers to use and create customized workflows. Here is how the aforementioned workflow may be defined using the DSL.


val getUsers = Step("Get Users", ...)
val wrangleData = Step("Wrangle Data", ...)
...
val regionSplit = Step("For Each Region", ...)
val regionJoin = Step("End For Each", ...)
val regions = Seq("US", "Canada", "UK_Ireland", "LatAm", ...)
val wf = start -> getUsers -> wrangleData ==> (
  trainGlobalModel -> validateGlobalModel,
  regionSplit **(reg = regions) --< (trainRegModel, validateRegModel) >-- regionJoin
) >== selectModel -> validateModel -> end


// If verbs are preferred over operators
val wf = sequence(start, getUsers, wrangleData) parallel {
  sequence(trainGlobalModel, validateGlobalModel)
  sequence(regionSplit,
           forEach(reg = regions) sequence(trainRegModel, validateRegModel) forEach,
           regionJoin)
} parallel sequence(selectModel, validateModel, end)

Extension architecture

Meson was built from the ground up to be extensible to make it easy to add custom steps and extensions. Spark Submit Step, Hive Query Step, Netflix specific extensions that allow us to reach out to microservices or other systems like Cassandra are a some examples.


In the above workflow, we built a Netflix specific extension to call out to our Docker execution framework that enables developers to specify the bare minimum parameters for their Docker images. The extension handles all communications like getting all the status URLs, the log messages and monitoring the state of the Docker process.

Artifacts

Outputs of steps can be treated as first class citizens within Meson and are stored as Artifacts. Retries of a workflow step can be skipped based on the presence or absence of an artifact id. We can also have custom visualization of artifacts within the Meson UI. For e.g. if we store feature importance as an artifact as part of a pipeline, we can plug in custom visualizations that allow us to compare the past n days of the feature importance.
Screen Shot 2016-05-27 at 4.01.02 PM.png

Mesos Master / Slave

Mesos is used for resource scheduling with Meson registered as the core framework. Meson’s custom Mesos executors are deployed across the slaves. These are responsible for  downloading all the jars and custom artifacts and send messages / context / heartbeats back to the Meson scheduler. Spark jobs submitted from Meson share the same Mesos slaves to run the tasks launched by the Spark job.

Native Spark Support

Supporting Spark natively within Meson was a key requirement and goal. The Spark Submit within Meson allows for monitoring of the Spark job progress from within Meson, has the ability to retry failed spark steps or kill Spark jobs that may have gone astray. Meson also supports the ability to target specific Spark versions - thus, supporting innovation for users that want to be on the latest version of Spark.


Supporting Spark in a multi-tenant environment via Meson came with an interesting set of challenges. Workflows have a varying set of resource requirements and expectations on total run time. Meson efficiently utilizes the available resources by matching the resource requirements and SLA expectation to a set of Mesos slaves that have the potential to meet the criteria. This is achieved by setting up labels for groups of Mesos slaves and using the Mesos resource attributes feature to target a job to a set of slaves.

ML Constructs

As adoption increased for Meson, a class of large scale parallelization problems like parameters sweeping, complex bootstraps and cross validation emerged.
Meson offers a simple ‘for-loop’ construct that allows data scientists and researchers to express parameter sweeps allowing them to run tens of thousands of docker containers across the parameter values. Users of this construct can monitor progress across the thousands of tasks in real time, find failed tasks via the UI and have logs streamed back to a single place within Meson making managing such parallel tasks simple.

Conclusion

Meson has been powering hundreds of concurrent jobs across multiple ML pipelines for the past year. It has been a catalyst in enabling innovation for our algorithmic teams thus improving overall recommendations to our members.


We plan to open source Meson in the coming months and build a community around it. If you want to help accelerate the pace of innovation and the open source efforts, join us.


Here are some screenshots of the Meson UI:


(click to enlarge)


Dynomite-manager: Managing Dynomite Clusters

$
0
0

Dynomite has been adopted widely inside Netflix due to its high performance and low latency attributes. In our recent blog, we showcased the performance of Dynomite with Redis as the underlying data storage engine. At this point (Q2 2016), there are almost 50 clusters with more than 1000 nodes, centrally managed by the Cloud Database Engineering (CDE) team. CDE team has a wide experience with other data stores, such as Cassandra, ElasticSearch and Amazon RDS.
Dynomite is used at Netflix both as a:
  1. Cache, with global replication, in front of Netflix’s data store systems e.g. Cassandra, ElasticSearch etc.
  2. Data store layer by itself with persistence and backups

The latter is achieved by keeping multiple copies of the data across AWS regions and Availability zones (high availability), client failover, cold bootstrapping (warm up), S3 backups, and other features. Most of these features are enabled through the use of Dynomite-manager (internally named Florida).
A Dynomite node consists of three processes:
  • Dynomite (the proxy layer)
  • Storage Engine (Redis, Memcached, RocksDB, LMDB, ForrestDB etc)
  • Dynomite-Manager

DynomiteEcosystem.jpgFig.1 Two Dynomite instances with Dynomite, Dynomite-manager and Redis as a data store
Depending on the requirements, Dynomite can support multiple storage engines from in-memory data stores like Redis and Memcached to SSD optimized storage engines like RocksDB, LMDB, ForestDB, etc.
Dynomite-manager is a sidecar specifically developed to manage Netflix’s Dynomite clusters and integrate it with the AWS (and Netflix) Ecosystem. It follows similar design principles from more than 6 years of experience of managing Cassandra with Priam, and ElasticSearch clusters with Raigad. Dynomite-manager was designed based on Quartz in order to be extensible to other data stores, and platforms. In the following, we briefly capture some of the key features of Dynomite-manager.

Service Discovery and Healthcheck

Dynomite-manager schedules a Quartz (lightweight thread) every 15 seconds that checks the health of both Dynomite and the underlying storage engine. Since most of our current production deployments leverage Redis, the healthcheck involves a two step approach. In the first step, we check if Dynomite and Redis are running as Linux processes, and in the second step, Dynomite-manager uses the Redis API to perform a PING to both Dynomite and Redis. A Redis PING, and the corresponding response, Redis PONG, ensures that both processes are alive and are able to serve client traffic. If any of these healthcheck steps fail, Dynomite-manager informs Eureka (Netflix Service registry for resilient mid-tier load balancing and failover) and the node is removed from Discovery. This ensures that the Dyno client can gracefully failover the traffic to another Dynomite node with the same token.
Screen Shot 2016-05-29 at 6.43.07 AM.png
Fig.2 Dynomite healthcheck failure on Spinnaker

Token Management and Node Configuration

Dynomite occupies the whole token range on a per rack basis. Hence, it uses a unique token in each rack (differently from Cassandra that uses unique token throughout the cluster). Therefore, tokens can repeat across racks and in the same datacenter.
Dynomite-manager calculates the token of every node by looking at the number of slots (nodes), by which the token range is divided in the rack, and the position of the node. The tokens are then stored in an external data store along with application id, availability zone, datacenter, instance id, hostname, and elastic IP.  Since nodes are by nature volatile in the cloud, if a node gets replaced, Dynomite-manager in the new node queries the data store to find if a token was pre-generated. At Netflix, we leverage a Cassandra cluster to store this information.
Dynomite-manager receives other instance metadata from AWS, and dynamic configuration through Archaius Configuration Management API or through the use of external data sources like SimpleDB. For the instance metadata, Dynomite-manager also includes an implementation for local deployments.

Monitoring and Insights Integration

Dynomite-manager exports the statistics of Dynomite and Redis to Atlas for plotting and time-series analysis. We use a tiered architecture for our monitoring system.
  1. Dynomite-manager receives information about Dynomite through a REST call;
  2. Dynomite-manager receives information about Redis through the INFO command.

Currently, Dynomite-manager leverages the Servo client to publish the metrics for time series processing. Nonetheless, other Insight clients can be added in order to deliver metrics to a different Insight system.

Cold Bootstrapping

Cold bootstrapping, also known as warm up, is the process of populating a node with the most recent data before joining the ring. Dynomite has a single copy of the data on each rack, essentially having multiple copies per datacenter (depending on the number of racks per datacenter). At Netflix, when Dynomite is used as a data store, we use three racks per datacenter for high availability. We manage these copies as separate AWS Auto scaling groups. Due to the volatile nature of the cloud or Chaos Monkey exercises, nodes may get terminated. During this time the Dyno client fails over to another node that holds the same token in a different availability zone.
When the new node comes up, Dynomite-manager on the new node is responsible for cold bootstrapping Redis in the same node. The above process enables our infrastructure to sustain multiple failures in production with minimal effect on the client side.In the following, we explain the operation in more detail:
  1. Dynomite-manager boots up due to auto-scaling activities, and a new token is generated for that node. In this case the new token is : 1383429731

Fig.3 Autoscaling brings a new node without data
  1. Dynomite-manager queries the external data store to identify which nodes within the local region have the same token. Dynomite-manager does not warm up from remote regions to avoid cross-region communication latencies. Once a target node is identified, Dynomite-manager tries to connect to it.

Fig.4 A peer node with the same token is identified
  1. Dynomite-manager issues a Redis SLAVEOF command to that peer. Effectively the target Redis instance sets itself as a slave of the redis instance on the peer node. For this, it leverages Redis diskless master-slave replication. In addition, Dynomite-manager sets Dynomite in buffering (standby) mode. This effectively allows the Dyno client to continuously failover to another AWS availability zone during the warm up process.

Fig.5 Dynomite-manager enables Redis replication
  1. Dynomite-manager continuously checks the offset between the Redis master node (the source of truth), and the Redis slave (the node that needs warm up). The offset is determined based on what the Redis master reports via the INFO command. A Dynomite node is considered fully warmed up, if it has received all the data from the remote node, or if the difference is less than a pre-set value. We use the latter to limit the warm-up duration in high throughput deployments.

Fig.6 Data streaming across nodes through Redis diskless replication
  1. Once master and slave are in sync, Dynomite-manager sets Dynomite to allow writes only. This mode allows writes to get buffered and flushed to Redis once everything is complete.
  2. Dynomite-manager stops Redis from peer syncing by using the Redis  SLAVEOF NO ONE command.
  3. Dynomite-manager sets Dynomite back to normal state, performs a final check if Dynomite is operational and notifies Service Discovery through the healthcheck.

Fig.8 Dynomite node is warmed up
  1. Done!

S3 Backups/Restores

At Netflix, Dynomite is used as a single point of truth (data store) as well as a cache. A dependable backup and recovery process is therefore critical for Disaster Recovery (DR) and Data Corruption (CR) when choosing a data store in the cloud. With Dynomite-manager, a daily snapshot for all clusters that leverage Dynomite as a data store is used to back them up to Amazon S3. S3 was an obvious choice due to its simple interface and ability to access any amount of data from anywhere.

Backup

Dynomite-manager initiates the S3 backups. The backups feature leverages the persistence feature of Redis to dump data to the drive. Dynomite-manager supports both the RDB and the AOF persistence of Redis, offering the ability to the users to use a readable format of their data for debugging or a memory direct snapshot. The backups leverage the IAM credentials in order to encrypt the communication. Backups (a) can be scheduled using a date in the configuration (or by leveraging Archaius, Netflix configuration management API), and (b) on demand using the REST API.

Restore

Dynomite-manager supports restoring a single node through a REST API, or the complete ring. When performing a restore, Dynomite-manager (on each node), shuts down Redis and Dynomite, locates the snapshot files in S3, and orchestrates the download of the files. Once the snapshot is transferred to the node, Dynomite-manager starts Redis and waits until the data are in memory, and then follows up with starting the Dynomite process. Dynomite-manager can also restore data to clusters with different names. This allows us to spin up multiple test clusters with the same data, enabling refreshes. Refreshes are very important at Netflix, because cluster users can leverage production data in a test environment, hence perform realistics benchmarks and offline analysis on production data. Finally, Dynomite-manager allows for targeted refreshes on a specific date, allowing cluster users to restore data to point prior to the data corruption, test production data for a specific time frame and opening the doors for many other use cases that we have not yet explored.

Credential Management

In regards to credentials, Dynomite-manager supports Amazon’s Identity and Access Management (IAM) key profile management. Using IAM Credentials allows the cluster administrator can provide access to the AWS API without storing an AccessKeyId or SecretAccessKey on the node itself. Alternatively, one can implement the IAMCredential interface.

Cluster Management

Upgrades/Rolling Restarts

With Dynomite-manager we can perform upgrades and rolling restarts of Dynomite clusters in production without any down time. For example, when we want to upgrade or restart Dynomite-manager itself, we increase the polling interval of the Discovery service, allowing the reads/writes to Dynomite and Redis to flow. On the other hand, when performing upgrades of Dynomite and Redis, we take the node out of the Discovery service by shutting down Dynomite-manager itself, and therefore allowing Dyno to gracefully fail over to another availability zone.

REST API

Dynomite-manager provides a REST API for multiple management activities. For example, the following administration operations can be performed through Dynomite-manager:
  • /start: start Dynomite
  • /stop: stop Dynomite
  • /startstorageprocess: start storage process
  • /stopstorageprocess: stops storage process
  • /get_seeds: responds with the hostnames and tokens
  • /cluster_describe: responds with a JSON file of the cluster level information
  • /s3backup: forces an S3 backups
  • /s3restore: forces an S3 restore

Future Ideas: Dynomite-manager 2.0

  • Backups: we will be investigating the use a bandwidth throttler during backup operation to reduce disk and network I/O. This is important for nodes that are receiving thousands of OPS. For better DR, we will also investigate the diversification of our backups across multiple object storage vendors.
  • Warm up: we will explore further resiliency in our warm up process. For example, we will be considering the use of incrementals for clusters that need to vertically scale to better instance types, as well as perform parallel warm up from multiple nodes if all nodes in the same region are healthy.
  • In line updates and restarts: currently, we manage Dynomite and the storage engine through python and shell scripts that are invoked through REST calls by our continuous integration system. Our plan is to integrate most of these management operations inside Dynomite-manager (binary upgrades, rolling restarts etc)
  • Healthcheck: Dynomite-manager has the perfect view of every Dynomite node, hence as Dynomite gets more mature, we plan to integrate auto-remediation inside Dynomite-manager. This can potentially minimize the amount of involvement of our engineers once the cluster is operational.

Today, we are open sourcing Dynomite-manager https://github.com/netflix/dynomite-manager
We will be looking forward to feedback, issues and bugs so that we can improve the Dynomite Ecosystem.

Toward A Practical Perceptual Video Quality Metric

$
0
0

by Zhi Li, Anne Aaron, Ioannis Katsavounidis, Anush Moorthy and Megha Manohara


At Netflix we care about video quality, and we care about measuring video quality accurately at scale. Our method, Video Multimethod Assessment Fusion (VMAF), seeks to reflect the viewer’s perception of our streaming quality.  We are open-sourcing this tool and invite the research community to collaborate with us on this important project.

Our Quest for High Quality Video

We strive to provide our members with a great viewing experience: smooth video playback, free of annoying picture artifacts. A significant part of this endeavor is delivering video streams with the best perceptual quality possible, given the constraints of the network bandwidth and viewing device. We continuously work towards this goal through multiple efforts.

First, we innovate in the area of video encoding. Streaming video requires compression using standards, such as H.264/AVC, HEVC and VP9, in order to stream at reasonable bitrates. When videos are compressed too much or improperly, these techniques introduce quality impairments, known as compression artifacts. Experts refer to them as “blocking”, “ringing” or “mosquito noise”, but for the typical viewer, the video just doesn’t look right. For this reason, we regularly compare codec vendors on compression efficiency, stability and performance, and integrate the best solutions in the market. We evaluate the different video coding standards to ensure that we remain at the cutting-edge of compression technology. For example, we run comparisons among H.264/AVC, HEVC and VP9, and in the near future we will experiment on the next-generation codecs developed by the Alliance for Open Media (AOM) and the Joint Video Exploration Team (JVET). Even within established standards we continue to experiment on recipe decisions (see Per-Title Encoding Optimization project) and rate allocation algorithms to fully utilize existing toolsets.

We encode the Netflix video streams in a distributed cloud-based media pipeline, which allows us to scale to meet the needs of our business. To minimize the impact of bad source deliveries, software bugs and the unpredictability of cloud instances (transient errors), we automate quality monitoring at various points in our pipeline. Through this monitoring, we seek to detect video quality issues at ingest and at every transform point in our pipeline.

Finally, as we iterate in various areas of the Netflix ecosystem (such as the adaptive streaming or content delivery network algorithms) and run A/B tests, we work to ensure that video quality is maintained or improved by the system refinements. For example, an improvement in the adaptive streaming algorithm that is aimed to reduce playback start delay or re-buffers should not degrade overall video quality in a streaming session.

All of the challenging work described above hinges on one fundamental premise: that we can accurately and efficiently measure the perceptual quality of a video stream at scale. Traditionally, in video codec development and research, two methods have been extensively used to evaluate video quality: 1) Visual subjective testing and 2) Calculation of simple metrics such as PSNR, or more recently, SSIM [1].

Without doubt, manual visual inspection is operationally and economically infeasible
for the throughput of our production, A/B test monitoring and encoding research experiments. Measuring image quality is an old problem, to which a number of simple and practical solutions have been proposed. Mean-squared-error (MSE), Peak-signal-to-noise-ratio (PSNR) and Structural Similarity Index (SSIM) are examples of metrics originally designed for images and later extended to video. These metrics are often used within codecs (“in-loop”) for optimizing coding decisions and for reporting the final quality of encoded video. Although researchers and engineers in the field are well-aware that PSNR does not consistently reflect human perception, it remains the de facto standard for codec comparisons and codec standardization work.

Building A Netflix-Relevant Dataset

To evaluate video quality assessment algorithms, we take a data-driven approach. The first step is to gather a dataset that is relevant to our use case. Although there are publicly available databases for designing and testing video quality metrics, they lack the diversity in content that is relevant to practical streaming services such as Netflix. Many of them are no longer state-of-the-art in terms of the quality of the source and encodes; for example, they contain standard definition (SD) content and cover older compression standards only. Furthermore, since the problem of assessing video quality is far more general than measuring compression artifacts, the existing databases seek to capture a wider range of impairments caused not only by compression, but also by transmission losses, random noise and geometric transformations. For example, real-time transmission of surveillance footage of typically black and white, low-resolution video (640x480) exhibits a markedly different viewing experience than that experienced when watching one’s favorite Netflix show in a living room.

Netflix's streaming service presents a unique set of challenges as well as opportunities for designing a perceptual metric that accurately reflects streaming video quality. For example:

Video source characteristics. Netflix carries a vast collection of movies and TV shows, which exhibit diversity in genre such as kids content, animation, fast-moving action movies, documentaries with raw footage, etc. Furthermore, they also exhibit diverse low-level source characteristics, such as film-grain, sensor noise, computer-generated textures, consistently dark scenes or very bright colors. Many of the quality metrics developed in the past have not been tuned to accommodate this huge variation in source content. For example, many of the existing databases lack animation content and most don’t take into account film grain, a signal characteristic that is very prevalent in professional entertainment content.

Source of artifacts. As Netflix video streams are delivered using the robust Transmission Control Protocol (TCP), packet losses and bit errors are never sources of visual impairments. That leaves two types of artifacts in the encoding process which will ultimately impact the viewer's quality of experience (QoE): compression artifacts (due to lossy compression) and scaling artifacts (for lower bitrates, video is downsampled before compression, and later upsampled on the viewer’s device). By tailoring a quality metric to only cover compression and scaling artifacts, trading generality for precision, its accuracy is expected to outperform a general-purpose one.

To build a dataset more tailored to the Netflix use case, we selected a sample of 34 source clips (also called reference videos), each 6 seconds long, from popular TV shows and movies from the Netflix catalog and combined them with a selection of publicly available clips. The source clips covered a wide range of high-level features (animation, indoor/outdoor, camera motion, face close-up, people, water, obvious salience, number of objects) and low level characteristics (film grain noise, brightness, contrast, texture, motion, color variance, color richness, sharpness). Using the source clips, we encoded H.264/AVC video streams at resolutions ranging from 384x288 to 1920x1080 and bitrates from 375 kbps to 20,000 kbps, resulting in about 300 distorted videos. This sweeps a broad range of video bitrates and resolutions to reflect the widely varying network conditions of Netflix members.

We then ran subjective tests to determine how non-expert observers would score the impairments of an encoded video with respect to the source clip. In standardized subjective testing, the methodology we used is referred to as the Double Stimulus Impairment Scale (DSIS) method. The reference and distorted videos were displayed sequentially on a consumer-grade TV, with controlled ambient lighting (as specified in recommendation ITU-R BT.500-13 [2]). If the distorted video was encoded at a smaller resolution than the reference, it was upscaled to the source resolution before it was displayed on the TV. The observer sat on a couch in a living room-like environment and was asked to rate the impairment on a scale of 1 (very annoying) to 5 (not noticeable).The scores from all observers were combined to generate a Differential Mean Opinion Score or DMOS for each distorted video and normalized in the range 0 to 100, with the score of 100 for the reference video. The set of reference videos, distorted videos and DMOS scores from observers will be referred to in this article as the NFLX Video Dataset.

Traditional Video Quality Metrics

How do the traditional, widely-used video quality metrics correlate to the “ground-truth” DMOS scores for the NFLX Video Dataset?
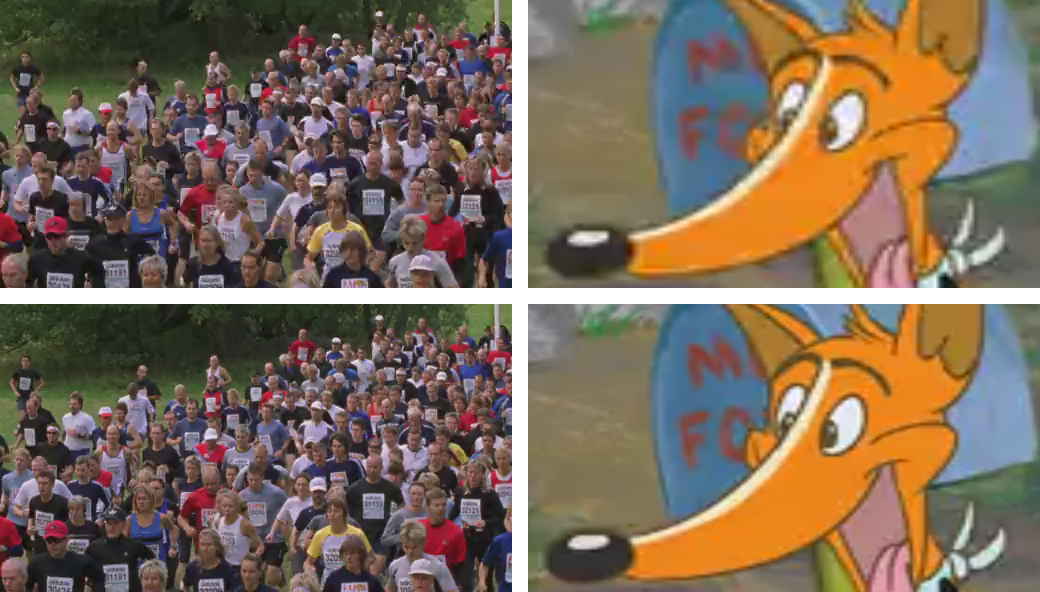
A Visual Example

VMAF_crowd_fox_crop_1040_592.png

Above, we see portions of still frames captured from 4 different distorted videos; the two videos on top reported a PSNR value of about 31 dB, while the bottom two reported a PSNR value of about 34 dB. Yet, one can barely notice the difference on the “crowd” videos, while the difference is much more clear on the two “fox” videos. Human observers confirm it by rating the two “crowd” videos as having a DMOS score of 82 (top) and 96 (bottom), while rating the two “fox” videos with DMOS scores of 27 and 58, respectively.
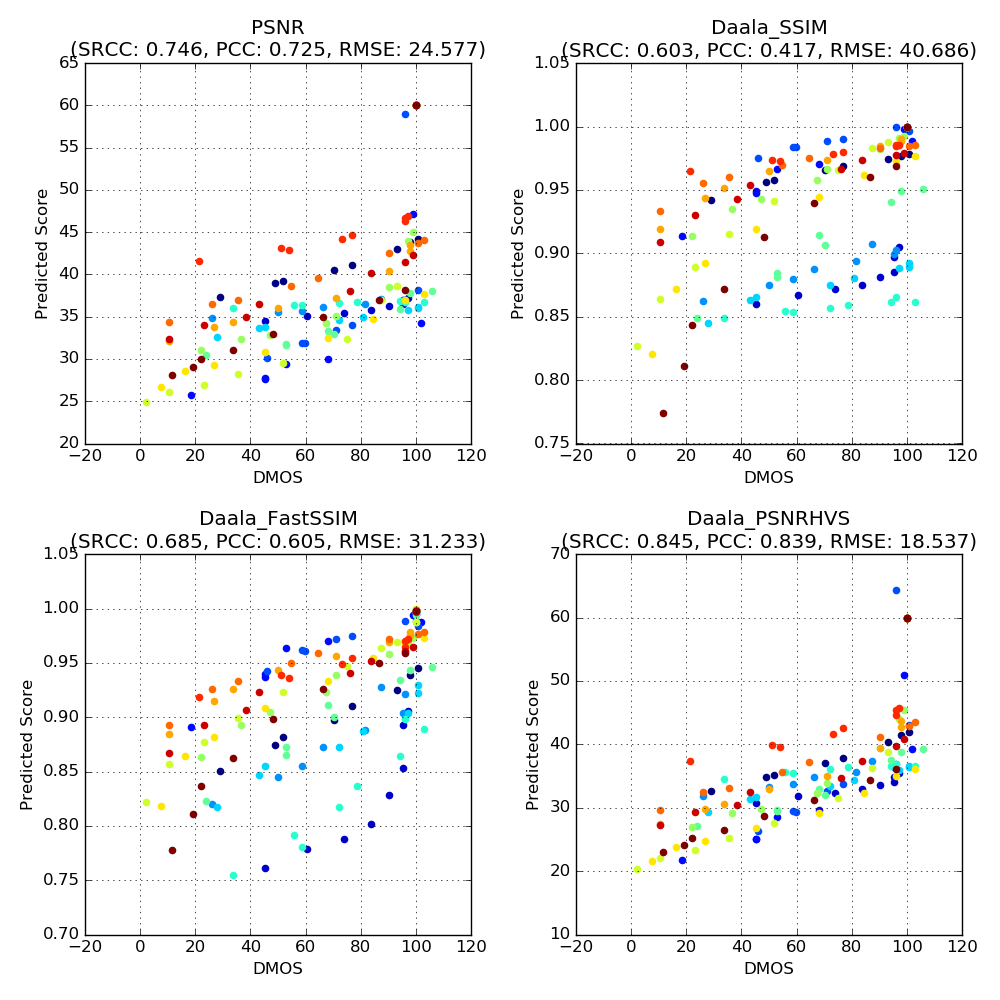
Detailed Results

The graphs below are scatter plots showing the observers’ DMOS on the x-axis and the predicted score from different quality metrics on the y-axis. These plots were obtained from a selected subset of the NFLX Video Dataset, which we label as NFLX-TEST (see next section for details). Each point represents one distorted video. We plot the results for four quality metrics:
  • PSNR for luminance component
  • SSIM [1]
  • Multiscale FastSSIM [3]
  • PSNR-HVS [4]
More details on SSIM, Multiscale FastSSIM and PSNR-HVS can be found in the publications listed in the Reference section. For these three metrics we used the implementation in the Daala code base [5] so the titles in subsequent graphs are prefixed with “Daala”.

nflx_test_others.png
Note: The points with the same color correspond to distorted videos stemming from the same reference video. Due to subject variability and reference video normalization to 100, some DMOS scores can exceed 100.

It can be seen from the graphs that these metrics fail to provide scores that consistently predict the DMOS ratings from observers. For example, focusing on the PSNR graph on the upper left corner, for PSNR values around 35 dB, the “ground-truth” DMOS values range anywhere from 10 (impairments are annoying) to 100 (impairments are imperceptible). Similar conclusions can be drawn for the SSIM and multiscale FastSSIM metrics, where a score close to 0.90 can correspond to DMOS values from 10 to 100. Above each plot, we report the Spearman’s rank correlation coefficient (SRCC), the Pearson product-moment correlation coefficient (PCC) and the root-mean-squared-error (RMSE) figures for each of the metrics, calculated after a non-linear logistic fitting, as outlined in Annex 3.1 of ITU-R BT.500-13 [2]. SRCC and PCC values closer to 1.0 and RMSE values closer to zero are desirable. Among the four metrics, PSNR-HVS demonstrates the best SRCC, PCC and RMSE values, but is still lacking in prediction accuracy.

In order to achieve meaningful performance across wide variety of content, a metric should exhibit good relative quality scores, i.e., a delta in the metric should provide information about the delta in perceptual quality. In the graphs below, we select three typical reference videos, a high-noise video, a CG animation and a TV drama, and plot the predicted score vs. DMOS of the different distorted videos for each. To be effective as a relative quality score, a constant slope across different clips within the same range of the quality curve is desirable. For example, referring to the PSNR plot below, in the range 34 dB to 36 dB, a change in PSNR of about 2 dB for TV drama corresponds to a DMOS change of about 50 (50 to 100) but a similar 2 dB change in the same range for the CG animation corresponds to less than 20 (40 to 60) change in DMOS. While SSIM and FastSSIM exhibit more consistent slopes for CG animation and TV drama clips, their performance is still lacking.
blogpost_others2.png
In conclusion, we see that the traditional metrics do not work well for our content. To address this issue we adopted a machine-learning based model to design a metric that seeks to reflect  human perception of video quality.  This metric is discussed in the following section.

Our Method: Video Multimethod Assessment Fusion (VMAF)

Building on our research collaboration with Prof. C.-C. J. Kuo and his group at the University of Southern California [6][7], we developed Video Multimethod Assessment Fusion, or VMAF, that predicts subjective quality by combining multiple elementary quality metrics. The basic rationale is that each elementary metric may have its own strengths and weaknesses with respect to the source content characteristics, type of artifacts, and degree of distortion. By ‘fusing’ elementary metrics into a final metric using a machine-learning algorithm - in our case, a Support Vector Machine (SVM) regressor - which assigns weights to each elementary metric, the final metric could preserve all the strengths of the individual metrics, and deliver a more accurate final score. The machine-learning model is trained and tested using the opinion scores obtained through a subjective experiment (in our case, the NFLX Video Dataset).

The current version of the VMAF algorithm and model (denoted as VMAF 0.3.1), released as part of the VMAF Development Kit open source software, uses the following elementary metrics fused by Support Vector Machine (SVM) regression [8]:
  1. Visual Information Fidelity (VIF) [9]. VIF is a well-adopted image quality metric based on the premise that quality is complementary to the measure of information fidelity loss. In its original form, the VIF score is measured as a loss of fidelity combining four scales. In VMAF, we adopt a modified version of VIF where the loss of fidelity in each scale is included as an elementary metric.
  2. Detail Loss Metric (DLM) [10]. DLM is an image quality metric based on the rationale of separately measuring the loss of details which affects the content visibility, and the redundant impairment which distracts viewer attention. The original metric combines both DLM and additive impairment measure (AIM) to yield a final score. In VMAF, we only adopt the DLM as an elementary metric. Particular care was taken for special cases, such as black frames, where numerical calculations for the original formulation break down.
VIF and DLM are both image quality metrics. We further introduce the following simple feature to account for the temporal characteristics of video:
  1. Motion. This is a simple measure of the temporal difference between adjacent frames. This is accomplished by calculating the average absolute pixel difference for the luminance component.
These elementary metrics and features were chosen from amongst other candidates through iterations of testing and validation.

We compare the accuracy of VMAF to the other quality metrics described above. To avoid unfairly overfitting VMAF to the dataset, we first divide the NFLX Dataset into two subsets, referred to as NFLX-TRAIN and NFLX-TEST. The two sets have non-overlapping reference clips. The SVM regressor is then trained with the NFLX-TRAIN dataset, and tested on NFLX-TEST. The plots below show the performance of the VMAF metric on the NFLX-TEST dataset and on the selected reference clips (high-noise video, a CG animation and TV drama). For ease of comparison, we repeat the plots for PSNR-HVS, the best performing metric from the earlier section. It is clear that VMAF performs appreciably better.vmaf_psnrhvs.png
vmaf_psnrhvs_3content.png
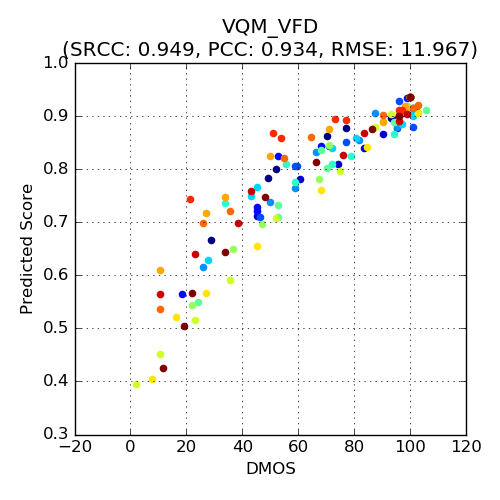
We also compare VMAF to the Video Quality Model with Variable Frame Delay (VQM-VFD) [11], considered by many as state of the art in the field. VQM-VFD is an algorithm that uses a neural network model to fuse low-level features into a final metric. It is similar to VMAF in spirit, except that it extracts features at lower levels such as spatial and temporal gradients.
vqmvfd.png
It is clear that VQM-VFD performs close to VMAF on the NFLX-TEST dataset. Since the VMAF approach allows for incorporation of new elementary metrics into its framework, VQM-VFD could serve as an elementary metric for VMAF as well.
The table below lists the performance, as measured by the SRCC, PCC and RMSE figures, of the VMAF model after fusing different combinations of the individual elementary metrics on the NFLX-TEST dataset, as well as the final performance of VMAF 0.3.1. We also list the performance of VMAF augmented with VQM-VFD. The results justify our premise that an intelligent fusion of high-performance quality metrics results in an increased correlation with human perception.
NFLX-TEST dataset

SRCC
PCC
RMSE
VIF
0.883
0.859
17.409
ADM
0.948
0.954
9.849
VIF+ADM
0.953
0.956
9.941
VMAF 0.3.1 (VIF+ADM
+MOTION)
0.953
0.963
9.277
VQM-VFD
0.949
0.934
11.967
VMAF 0.3.1
+VQM-VFD
0.959
0.965
9.159

Summary of Results

In the tables below we summarize the SRCC, PCC and RMSE of the different metrics discussed earlier, on the NLFX-TEST dataset and three popular public datasets: the VQEG HD (vqeghd3 collection only) [12], the LIVE Video Database [13] and the LIVE Mobile Video Database [14]. The results show that VMAF 0.3.1 outperforms other metrics in all but the LIVE dataset, where it still offers competitive performance compared to the best-performing VQM-VFD. Since VQM-VFD demonstrates good correlation across the four datasets, we are experimenting with VQM-VFD as an elementary metric for VMAF; although it is not part of the open source release VMAF 0.3.1, it may be integrated in subsequent releases.

NFLX-TEST dataset

SRCC
PCC
RMSE
PSNR
0.746
0.725
24.577
SSIM
0.603
0.417
40.686
FastSSIM
0.685
0.605
31.233
PSNR-HVS
0.845
0.839
18.537
VQM-VFD
0.949
0.934
11.967
VMAF 0.3.1
0.953
0.963
9.277

LIVE dataset*

SRCC
PCC
RMSE
PSNR
0.416
0.394
16.934
SSIM
0.658
0.618
12.340
FastSSIM
0.566
0.561
13.691
PSNR-HVS
0.589
0.595
13.213
VQM-VFD
0.763
0.767
9.897
VMAF 0.3.1
0.690
0.655
12.180
*For compression-only impairments (H.264/AVC and MPEG-2 Video)

VQEGHD3 dataset*

SRCC
PCC
RMSE
PSNR
0.772
0.759
0.738
SSIM
0.856
0.834
0.621
FastSSIM
0.910
0.922
0.415
PSNR-HVS
0.858
0.850
0.580
VQM-VFD
0.925
0.924
0.420
VMAF 0.3.1
0.929
0.939
0.372
*For source content SRC01 to SRC09 and streaming-relevant impairments HRC04, HRC07, and HRC16 to HRC21

LIVE Mobile dataset

SRCC
PCC
RMSE
PSNR
0.632
0.643
0.850
SSIM
0.664
0.682
0.831
FastSSIM
0.747
0.745
0.718
PSNR-HVS
0.703
0.726
0.722
VQM-VFD
0.770
0.795
0.639
VMAF 0.3.1
0.872
0.905
0.401

VMAF Development Kit (VDK) Open Source Package

To deliver high-quality video over the Internet, we believe that the industry needs good perceptual video quality metrics that are practical to use and easy to deploy at scale. We have developed VMAF to help us address this need. Today, we are open-sourcing the VMAF Development Kit (VDK 1.0.0) package on Github under Apache License Version 2.0. By open-sourcing the VDK, we hope it can evolve over time to yield improved performance.

The feature extraction (including elementary metric calculation) portion in the VDK core is computationally-intensive and so it is written in C for efficiency. The control code is written in Python for fast prototyping.

The package comes with a simple command-line interface to allow a user to run VMAF in single mode (run_vmaf command) or in batch mode (run_vmaf_in_batch command, which optionally enables parallel execution). Furthermore, as feature extraction is the most expensive operation, the user can also store the feature extraction results in a datastore to reuse them later.

The package also provides a framework for further customization of the VMAF model based on:
  • The video dataset it is trained on
  • The elementary metrics and other features to be used
  • The regressor and its hyper-parameters

The command run_training takes in three configuration files: a dataset file, which contains information on the training dataset, a feature parameter file and a regressor model parameter file (containing the regressor hyper-parameters). Below is sample code that defines a dataset, a set of selected features, the regressor and its hyper-parameters.

##### define a dataset #####
dataset_name = 'example'
yuv_fmt = 'yuv420p'
width = 1920
height = 1080
ref_videos = [
   {'content_id':0, 'path':'checkerboard.yuv'},
   {'content_id':1, 'path':'flat.yuv'},
]
dis_videos = [
   {'content_id':0, 'asset_id': 0, 'dmos':100, 'path':'checkerboard.yuv'}, # ref
   {'content_id':0, 'asset_id': 1, 'dmos':50,  'path':'checkerboard_dis.yuv'},
   {'content_id':1, 'asset_id': 2, 'dmos':100,  'path':'flat.yuv'}, # ref
   {'content_id':1, 'asset_id': 3, 'dmos':80,  'path':'flat_dis.yuv'},
]

##### define features #####
feature_dict = {
   # VMAF_feature/Moment_feature are the aggregate features
   # motion, adm2, dis1st are the atom features
   'VMAF_feature':['motion', 'adm2'],
   'Moment_feature':['dis1st'], # 1st moment on dis video
}

##### define regressor and hyper-parameters #####
model_type = "LIBSVMNUSVR" # libsvm NuSVR regressor
model_param_dict = {
   # ==== preprocess: normalize each feature ==== #
   'norm_type':'clip_0to1', # rescale to within [0, 1]
   # ==== postprocess: clip final quality score ==== #
   'score_clip':[0.0, 100.0], # clip to within [0, 100]
   # ==== libsvmnusvr parameters ==== #
   'gamma':0.85, # selected
   'C':1.0, # default
   'nu':0.5, # default
   'cache_size':200 # default
}

Finally, the FeatureExtractor base class can be extended to develop a customized VMAF algorithm. This can be accomplished by experimenting with other available elementary metrics and features, or inventing new ones. Similarly, the TrainTestModel base class can be extended in order to test other regression models. Please refer to CONTRIBUTING.md for more details. A user could also experiment with alternative machine learning algorithms using existing open-source Python libraries, such as scikit-learn [15], cvxopt [16], or tensorflow [17]. An example integration of scikit-learn’s random forest regressor is included in the package.

The VDK package includes the VMAF 0.3.1 algorithm with selected features and a trained SVM model based on subjective scores collected on the NFLX Video Dataset. We also invite the community to use the software package to develop improved features and regressors for the purpose of perceptual video quality assessment. We encourage users to test VMAF 0.3.1 on other datasets, and help improve it for our use case and potentially extend it to other use cases.

Our Open Questions on Quality Assessment

Viewing conditions. Netflix supports thousands of active devices covering smart TV’s, game consoles, set-top boxes, computers, tablets and smartphones, resulting in widely varying viewing conditions for our members. The viewing set-up and display can significantly affect perception of quality. For example, a Netflix member watching a 720p movie encoded at 1 Mbps on a 4K 60-inch TV may have a very different perception of the quality of that same stream if it were instead viewed on a 5-inch smartphone. The current NFLX Video Dataset covers a single viewing condition -- TV viewing at a standardized distance. To augment VMAF, we are conducting subjective tests in other viewing conditions. With more data, we can generalize the algorithm such that viewing conditions (display size, distance from screen, etc.) can be inputs to the regressor.

Temporal pooling. Our current VMAF implementation calculates quality scores on a per-frame basis. In many use-cases, it is desirable to temporally pool these scores to return a single value as a summary over a longer period of time. For example, a score over a scene, a score over regular time segments, or a score for an entire movie is desirable. Our current approach is a simple temporal pooling that takes the arithmetic mean of the per-frame values. However, this method has the risk of “hiding” poor quality frames. A pooling algorithm that gives more weight to lower scores may be more accurate towards human perception. A good pooling mechanism is especially important when using the summary score to compare encodes of differing quality fluctuations among frames or as the target metric when optimizing an encode or streaming session. A perceptually accurate temporal pooling mechanism for VMAF and other quality metrics remains an open and challenging problem.

A consistent metric. Since VMAF incorporates full-reference elementary metrics, VMAF is highly dependent on the quality of the reference. Unfortunately, the quality of video sources may not be consistent across all titles in the Netflix catalog. Sources come into our system at resolutions ranging from SD to 4K. Even at the same resolution, the best source available may suffer from certain video quality impairments. Because of this, it can be inaccurate to compare (or summarize) VMAF scores across different titles. For example, when a video stream generated from an SD source achieves a VMAF score of 99 (out of 100), it by no means has the same perceptual quality as a video encoded from an HD source with the same score of 99. For quality monitoring, it is highly desirable that we can calculate absolute quality scores that are consistent across sources. After all, when viewers watch a Netflix show, they do not have any reference, other than the picture delivered to their screen. We would like to have an automated way to predict what opinion they form about the quality of the video delivered to them, taking into account all factors that contributed to the final presented video on that screen.

Summary

We have developed VMAF 0.3.1 and the VDK 1.0.0 software package to aid us in our work to deliver the best quality video streams to our members. Our team uses it everyday in evaluating video codecs and encoding parameters and strategies, as part of our continuing pursuit of quality. VMAF, together with other metrics, have been integrated into our encoding pipeline to improve on our automated QC. We are in the early stages of using VMAF as one of the client-side metrics to monitor system-wide A/B tests.

Improving video compression standards and making smart decisions in practical encoding systems is very important in today’s Internet landscape. We believe that using the traditional metrics - metrics that do not always correlate with human perception - can hinder real advancements in video coding technology. However, always relying on manual visual testing is simply infeasible. VMAF is our attempt to address this problem, using samples from our content to help design and validate the algorithms. Similar to how the industry works together in developing new video standards, we invite the community to openly collaborate on improving video quality measures, with the ultimate goal of more efficient bandwidth usage and visually pleasing video for all.

Acknowledgments

We would like to acknowledge the following individuals for their help with the VMAF project: Joe Yuchieh Lin, Eddy Chi-Hao Wu, Professor C.-C Jay Kuo (University of Southern California), Professor Patrick Le Callet (Université de Nantes) and Todd Goodall.

References

[1] Z. Wang, A. C. Bovik, H. R. Sheikh, and E. P. Simoncelli, “Image Quality Assessment: From Error Visibility to Structural Similarity,” IEEE Transactions on Image Processing, vol. 13, no. 4, pp. 600–612, Apr. 2004.

[2] BT.500 : Methodology for the Subjective Assessment of the Quality of Television Pictures, https://www.itu.int/rec/R-REC-BT.500

[3] M.-J. Chen and A. C. Bovik, “Fast Structural Similarity Index Algorithm,” Journal of Real-Time Image Processing, vol. 6, no. 4, pp. 281–287, Dec. 2011.

[4] N. Ponomarenko, F. Silvestri, K. Egiazarian, M. Carli, J. Astola, and V. Lukin, “On Between-coefficient Contrast Masking of DCT Basis Functions,” in Proceedings of the 3 rd International Workshop on Video Processing and Quality Metrics for Consumer Electronics (VPQM ’07), Scottsdale, Arizona, Jan. 2007.


[6] T.-J. Liu, J. Y. Lin, W. Lin, and C.-C. J. Kuo, “Visual Quality Assessment: Recent Developments, Coding Applications and Future Trends,” APSIPA Transactions on Signal and Information Processing, 2013.

[7] J. Y. Lin, T.-J. Liu, E. C.-H. Wu, and C.-C. J. Kuo, “A Fusion-based Video Quality Assessment (FVQA) Index,” APSIPA Transactions on Signal and Information Processing, 2014.

[8] C.Cortes and V.Vapnik, “Support-Vector Networks,” Machine Learning, vol. 20, no. 3, pp. 273–297, 1995.

[9] H. Sheikh and A. Bovik, “Image Information and Visual Quality,” IEEE Transactions on Image Processing, vol. 15, no. 2, pp. 430–444, Feb. 2006.

[10] S. Li, F. Zhang, L. Ma, and K. Ngan, “Image Quality Assessment by Separately Evaluating Detail Losses and Additive Impairments,” IEEE Transactions on Multimedia, vol. 13, no. 5, pp. 935–949, Oct. 2011.

[11] S. Wolf and M. H. Pinson, “Video Quality Model for Variable Frame Delay (VQM_VFD),” U.S. Dept. Commer., Nat. Telecommun. Inf. Admin., Boulder, CO, USA, Tech. Memo TM-11-482, Sep. 2011.

[12] Video Quality Experts Group (VQEG), “Report on the Validation of Video Quality Models for High Definition Video Content,” June 2010, http://www.vqeg.org/

[13] K. Seshadrinathan, R. Soundararajan, A. C. Bovik and L. K. Cormack, "Study of Subjective and Objective Quality Assessment of Video", IEEE Transactions on Image Processing, vol.19, no.6, pp.1427-1441, June 2010.

[14] A. K. Moorthy, L. K. Choi, A. C. Bovik and G. de Veciana, "Video Quality Assessment on Mobile Devices: Subjective, Behavioral, and Objective Studies," IEEE Journal of Selected Topics in Signal Processing, vol. 6, no. 6, pp. 652-671, Oct. 2012.

[15] scikit-learn: Machine Learning in Python. http://scikit-learn.org/stable/

[16] CVXOPT: Python Software for Convex Optimization. http://cvxopt.org/

[17] TensorFlow. https://www.tensorflow.org/

Netflix Billing Migration to AWS

$
0
0

On January 4, 2016, right before Netflix expanded itself into 130 new countries, Netflix Billing infrastructure became 100% AWS cloud-native. Migration of Billing infrastructure from Netflix Data Center(DC) to AWS Cloud was part of a broader initiative. This prior blog postis a great read that summarizes our strategic goals and direction towards AWS migration.  


For a company, its billing solution is its financial lifeline, while at the same time, it is a visible representation of a company’s attitude towards its customers. A great customer experience is one of Netflix’s core values. Considering the sensitive nature of Billing for its direct impact on our monetary relationship with our members as well on financial reporting, this migration needed to be handled as delicately as possible. Our primary goal was to define a secure, resilient and granular path for migration to the Cloud, without impacting the member experience.


This blog entry discusses our approach to migration of a complex Billing ecosystem from Netflix Data Center(DC) into AWS Cloud.


Components of our Billing architecture
Billing infrastructure is responsible for managing the billing state of Netflix members. This includes keeping track of open/paid billing periods, the amount of credit on the member’s account, managing payment status of the member, initiating charge requests and what date the member has paid through. Other than these, billing data feeds into financial systems for revenue and tax reporting for Netflix accounting.  To accomplish above, billing engineering encompasses:


  • Batch jobs to create recurring renewal orders for a global subscriber base, aggregated data feeds into our General Ledger(GL) for daily revenue from all payment methods including gift cards, Tax Service that reads from and posts into Tax engine. Generation of  messaging events and streaming/DVD hold events based on billing state of customers.
  • Billing APIs provide  billing and gift card details to the customer service platform and website. Other than these, Billing APIs are also part of workflows initiated to process user actions like member signup, change plan, cancellation, update address, chargebacks, and refund requests.
  • Integrations with different services  like member account service, payment processing, customer service, customer messaging, DVD website and shipping


Billing systems had integrations in DC as well as in cloud with the cloud-native systems.  At a high level, our pre-migration architecture could be abstracted out as below:-
Considering how much code and data was interacting with Oracle, one of our objectives was to disintegrate our giant Oracle based solution into a services based architecture. Some of our APIs needed to be multi-region and highly available. So we decided  to split our data into multiple data stores. Subscriber data was migrated to Cassandra data store. Our payment processing integration needed ACID transaction. Hence all relevant data was migrated to MYSQL. Following is a representation of our post migration architecture.


Challenges
As we approached the mammoth task of migration, we were keenly aware of the many challenges in front of us


  • Our migration should ideally not take any downtime for user facing flows.
  • Our new architecture in AWS would need to scale to rapidly growing the member base.
  • We had billions of rows of data, constantly changing and composed of all the historical data since Netflix’s inception in 1997. It was growing every single minute in our large shared database on Oracle. To move all this data over to AWS, we needed to first transport  and synchronize the  data in real time, into a double digit Terabyte RDBMS in cloud.
  • Being a SOX system added another layer of complexity, since all the migration and tooling needed to adhere to our SOX processes.
  • Netflix was launching in many new countries and marching towards being global soon.
  • Billing migration needed to happen without adversely impacting other teams that were busy with their own migration and global launch milestones.


Approach
Our approach to migration was guided by simple principles that helped us in defining the way forward. We will cover the most important ones below:


  • Challenge complexity and simplify:It is much easier to simply accept complexity inherent in legacy systems than challenge it, though when you are floating in a lot of data and code, simplification becomes the key. It seemed very intimidating until we spent a few days opening up everything and asking ourselves repeatedly about how else we could simplify.


    • Cleaning up Code: We started chipping away existing code into smaller, efficient modules and first moved some critical dependencies to run from the Cloud. We moved our tax solution to the Cloud first.


Next, we retired serving member billing history from giant tables that were part of  many different code paths. We built a new application to capture billing events, migrated only necessary data into our new Cassandra data store and started serving billing history, globally, from the Cloud.


We spent a good amount of time writing a data migration tool that would transform member  billing attributes spread across many tables in Oracle  into a much simpler Cassandra data structure.


We worked with our DVD engineering counterparts to further simplify our integration and got rid of obsolete code.


    • Purging Data: We took a hard look at every single table to ensure that we were migrating only what we needed and leaving everything else behind. Historical billing data is valuable to legal and customer service teams. Our goal was to migrate only necessary data into the Cloud. So, we worked with impacted teams  to find out what parts of historical data they really needed. We identified alternative data stores that could serve old data for these teams. After that, we started purging data that was obsolete and was not needed for any function.


  • Build tooling to be resilient and compliant: Our goal was to migrate applications incrementally with zero downtime. To achieve this, we built proxies and redirectors to pipe data back into DC. This helped us in keeping our applications in DC , unimpacted by the change, till we were ready to migrate them.


We had to build tooling in order to support our Billing Cloud infrastructure which needed to be SOX compliant.  For SOX compliance we needed to ensure mitigation of unexpected developer actions and auditability of actions.   


Our Cloud deployment tool Spinnaker was enhanced to capture details of deployment and pipe events to Chronos and our Big Data Platform for auditability. We needed to enhance Cassandra client for authentication and auditable actions. We wrote new alerts using Atlas that would help us in monitoring our applications and data in the Cloud.


With the help of our Data analytics team, we built a comparator to reconcile subscriber data in Cassandra datastore against data in Oracle by country and report mismatches. To achieve the above, we heavily used Netflix Big Data Platform to capture deployment events, used sqoop to transport data from our Oracle database and Cassandra clusters to Hive. We wrote Hive queries and MapReduce jobs for needed reports and dashboards.


  • Test with a clean and limited dataset first. How global expansion helped us: As Netflix was launching in new countries, it created a lot of challenges for us, though it also provided an opportunity to test our Cloud infrastructure with new, clean data, not weighted down by legacy. So, we created a new skinny billing infrastructure in Cloud, for all the user facing functionality and a skinny version of our renewal batch process, with integration into DC applications, to complete the billing workflow. Once the data for new countries could be successfully processed in the Cloud, it gave us the confidence to extend the Cloud footprint for existing large legacy countries, especially the US, where we support not only streaming but DVD billing as well.


  • Decouple user facing flows to shield customer experience from downtimes or other migration impacts:As we were getting ready to migrate existing members’ data into Cassandra, we needed downtime to halt processing while we migrated subscription data from Oracle to Cassandra for our APIs and batch renewal in Cloud. All our tooling was built around ability to migrate a country at time and tunnel traffic as needed.


We worked with ecommerce  and membership services to change integration in user workflows to an asynchronous model. We built retry capabilities to rerun failed processing and repeat as needed. We added optimistic customer state management to ensure our members  were not penalized while our processing was halted.  


By doing all the above, we transformed and moved millions of rows from Oracle in DC  to Cassandra in AWS without any obvious user impact.


  • Moving a database needs its own strategic planning: Database movement needs to be planned out while keeping the end goal in sight, or else it can go very wrong. There are many decisions to be made, from storage prediction to absorbing at least a year’s worth of growth in data that translates into number of instances needed, licensing costs for both production and test environments, using RDS services vs. managing larger EC2 instances, ensuring that database architecture can address scalability, availability and reliability of data. Creating disaster recovery plan, planning minimal migration downtime possible and the list goes on. As part of this migration, we decided to migrate from licenced Oracle to open source MYSQL database running on Netflix managed EC2 instances.


While our subscription processing was using data in our Cassandra datastore, our payment processor needed ACID capabilities of an RDBMS to process charge transactions. We still had a multi-terabyte database that would not fit in AWS RDS with TB limitations. With the help of Netflix platform core and database engineering, we  defined a multi-region, scalable architecture for our MYSQL master with DRBD copy and multiple read replicas available in different regions. We also moved all our ETL processing to replicas to avoid resource contention on the Master. Database Cloud Engineering built tooling and alerts for MYSQL instances to ensure monitoring and recovery as needed.


Our other biggest challenge was migrating constantly changing data to MYSQL in AWS, without taking any downtime. After exploring many options, we proceeded with  Oracle GoldenGate, which could replicate our tables across heterogeneous databases, along with ongoing incremental changes. Of course, this was a very large movement of data, that ran in parallel to our production operations and other migration for a couple of months. We conducted iterative testing and issue fixing cycles to run our applications against MYSQL.  Eventually, many weeks before flipping the switch, we started running our test database on MYSQL and would fix and test all issues on MYSQL code branch before doing a final validation on Oracle and releasing in production. Running our test environment against  MYSQL continuously created a great feedback loop for us.


Finally, on January 4, with a flip of a switch, we were able to move our processing and data ETLs against MYSQL.  


Reflection
While our migration to the Cloud was relatively smooth, looking back, there are always a few things we could have done better. We underestimated testing automation needs. We did not have a good way to test end to end flows. Having spent enough effort on these aspects, upfront, would have given us better developer velocity.


Migrating something as critical as billing with scale and legacy that needed to be addressed was plenty of work, though the benefits from the migration and simplification are also numerous. Post migration, we are more efficient and lighter in our software footprint than before. We are able to fully utilize Cloud capabilities in tooling, alerting and monitoring provided by the Netflix platform services. Our applications are able to scale horizontally as needed, which has helped us in keeping up our processing with subscriber growth.


In conclusion, billing migration was a major cross functional engineering effort. Different engineering teams: core platform, security, database engineering, tooling, big data platform, business teams and other engineering teams supported us through this. We plan to cover focused topics on database migration and engineering perspectives as a continuing series of blog posts in the future.


Once in the Cloud, we now see numerous opportunities to further enhance our services by using innovations of AWS and the Netflix platform. Netflix being global is bringing many more interesting challenges to our path. We have started our next big effort to re-architect our billing platform to become even more  efficient and distributed for a global subscriber scale. If you are interested in helping us solve these problems, we are hiring!


-By Stevan Vlaovic, Rahul Pilani, Subir Parulekar& Sangeeta Handa

Netflix and the IMF Community

$
0
0

Photon OSS - IMF validation for the masses

When you’ve got something this good, it’s hard to keep it to yourself. As we develop our IMF validation tools internally, we are merging them into a public git repository. The project, code-named Photon (to imply a torchbearer), was envisioned to aid a wider adoption of the IMF standard, and to simplify the development of IMF tools. It could be utilized in a few different ways: as a core library for building a complete end-to-end IMF content ingestion workflow, a web-service backend providing quick turnaround in validating IMF assets or even as a reference implementation of the IMF standard.

Photon in the Netflix Content Processing Pipeline

IMF presents new opportunities and significant challenges to the Digital Supply Chain ecosystem. Photon embodies all our knowledge and experience of building an automated, distributed cloud-based content ingestion workflow. At the time of this blog, we have fully integrated Photon into the Netflix IMF workflow and continue to enhance it as our workflow requirements evolve. A simple 3-step diagram of the Netflix content processing workflow (as discussed in our last tech blog Netflix IMF Workflow) along with the usage of Photon is shown in the figure below.
Screen Shot 2016-06-13 at 3.32.21 PM.png
Photon has all the necessary logic for parsing, reading and validating IMF assets including AssetMap, Packing List (PKL), Composition Playlist (CPL) and Audio/Video track files. Some of the salient features of Photon that we have leveraged in building our IMF content ingestion workflow are:
  1. A modular architecture along with a set of thread safe classes for validating IMF assets such as Composition Playlist, Packing List and AssetMap.
  2. A model to enforce IMF constraints on structural metadata of track files and Composition Playlists.
  3. Support for multiple namespaces for Composition Playlist, Packing List and AssetMap in order to remain compliant with the newer schemas published by SMPTE.
  4. A parser/reader to interpret metadata within IMF track files and serialize it as a SMPTE st2067-3 (the Composition Playlist specification) compliant XML document.
  5. Implementation of deep inspection of IMF assets including algorithms for Composition Playlist conformance and associativity (more on this aspect below).
  6. A stateless interface for IMF validation that could be used as a backend in a RESTful web service for validating IMF packages.

IMF Composition in the Real World

As IMF evolves, so will the tools used to produce IMF packages. While the standard and tools mature we expect to receive assets in the interim that haven’t caught up with the latest specifications. In order to minimize such malformed assets from making their way into our workflow we are striving to implement algorithms for performing deep inspections. In the earlier section we introduced two algorithms implemented in Photon for deep inspections, namely Composition Playlist conformance and Composition Playlist associativity. We will attempt to define and elaborate on these algorithms in this section.

Composition Playlist Conformance

We define a Composition Playlist to be conformant if the entire file descriptor metadata structure (including sub-descriptors) present in each track file that is a part of the composition is mapped to a single essence descriptor element in the Composition Playlist’s Essence Descriptor List. The algorithm to determine Composition Playlist conformance comprises the following steps:
  1. Parse and read all the essence descriptors along with their associated sub-descriptors from every track file that is a part of the composition.
  2. Parse and read all the essence descriptor elements along with their associated sub-descriptors in the Essence Descriptor List.
  3. Verify that every Essence Descriptor in the Essence Descriptor List is referenced by at least one track file in the composition. If not the Composition Playlist is not conformant.
  4. Identify the essence descriptor in the Essence Descriptor List corresponding to the next track file. This is done by utilizing syntactical elements defined in the Composition Playlist - namely Track File ID and SourceEncoding element. If not present the Composition Playlist is not conformant.
  5. Compare the identified essence descriptor and its sub-descriptors present in the Essence Descriptor List with the corresponding essence descriptor and its sub-descriptors present in the track file. At least one essence descriptor and sub-descriptors in the Track file should match with the corresponding essence descriptor and sub-descriptors in the Essence Descriptor List. If not, the Composition Playlist is not conformant.

The algorithmic approach we have adopted to perform this check is depicted in the following flow chart:

Composition Associativity

The current definition of IMF allows for version management between one IMF publisher and one IMF consumer. In the real world, multiple parties (content partners, fulfillment partners, etc.) often work together to produce a finished title. This suggests the need for a multi-party version management system (along the lines of software version control systems). While the IMF standard does not preclude this - this aspect is missing in existing IMF implementations and does not have industry mind-share as of yet. We have come up with the concept of Composition associativity as a solution to identify and associate Composition Playlists of the same presentation that were not constructed incrementally. Such scenarios could occur when multiple Composition Playlist assets are received for a certain title where each asset fulfills certain supplemental tracks of the original video presentation.  As an example,  let us say a content partner authors a Composition Playlist for a certain title with an original video track and an English audio track, whereas the fulfillment partner publishes a Composition Playlist with the same original video track and a Spanish audio track.

The current version of the algorithm for verifying composition associativity comprises the following checks:
  1. Verify that the constituent edit units of the original video track across all of the Composition Playlists are temporally aligned and represent the same video material. If not, the Composition Playlists are not associative.
  2. Verify that the constituent edit units of a particular audio language track, if present, in multiple Composition Playlists to be associated are temporally aligned and represent the same audio material. If not, the Composition Playlists are not associative.
  3. Repeat step 2 for the intersection set of all the audio language tracks in each of the Composition Playlist files.
Note that as of this writing, Photon does not yet have support for IMF virtual marker track as well as data tracks such as timed text, hence we do not yet include those track types in our associativity checks. A flow chart of the composition associativity algorithm follows:

How to get Photon, use it and contribute to it

Photon is hosted on the Netflix GitHub page and is licensed under the Apache License Version 2.0 terms making it very easy to use. It can be built using a gradle environment and is accompanied by a completely automated build and continuous integration system called Travis. All releases of Photon are published to Maven Central as a java archive and users can include it in their projects as a dependency using the relevant syntax for their build environment. The code base is structured in the form of packages that are intuitively named to represent the functionality that they embody. We recommend reviewing the classes in the “app” package to start with as they exercise almost all of the core implementation of the library and therefore offer valuable insight into the software structure which can be very useful to anyone that would like to get involved in the project or simply wants to understand the implementation. A complete set of Javadocs and necessary readme files are also maintained at the GitHub location and can be consulted for API reference and general information about the project.

In addition to the initiative of driving adoption of IMF in the industry, the intention for open sourcing Photon has also been to encourage and seek contributions from the Open Source community to help improve what we have built. Photon is still in its early stage of development making it very attractive for new contributions. Some of the areas in which we are seeking feedback as well as contributions but not limited to are as follows:
  1. Software design and architectural improvements.
  2. Well designed APIs and accompanying Java documents.
  3. Code quality and robustness improvements.
  4. More extensive tests and code coverage.

We have simplified the process of contributing to Photon by allowing contributors to submit pull requests for review and/or forking the repository and enhancing it as necessary. Every commit is gated by a test suite, FindBugs and PMD checks before becoming ready to be accepted for merge into the mainline.

It is our belief that significant breakthroughs with Photon can only be achieved by a high level of participation and collaboration within the Open Source community. Hence we require that all Photon submissions adhere to the Apache 2.0 license terms and conditions.

Netflix IMF Roadmap

As we continue to contribute to Photon to bridge the gap between its current feature set and the IMF standard, our  strategic initiatives and plans around IMF include the following:
  1. We are participating in various standardization activities related to IMF. These include our support for standardization of TTML2 in W3C as well as HDR video and immersive audio in the SMPTE IMF group. We are very enthusiastic about ACES for IMF. Netflix has sponsored multiple IMF meetups and interop plugfests.   
  2. We are actively investing in open source software (OSS) activities around IMF and hoping to foster a collaborative and vibrant developer community. Examples of other OSS projects sponsored by Netflix include “imf-validation-tool” and “regxmllib”.
  3. We are engaged in the development of tools that make it easy to use as well as embed IMF in existing workflows. An example of an ongoing project is the ability to transcode from IMF to DPP (Digital Production Partnership - an initiative formed jointly by public service broadcasters in the UK to help producers and broadcasters maximize the potential benefits of digital television production) or IMF to iTunes ecosystems. Another example is the “IMF CPL Editor” project. This will be available on GitHub and will support lightweight editing of the CPL such as metadata and timeline changes.
  4. IMF at its heart is an asset distribution and archival standard. Effective industry-wide automation in the digital supply chain could be achieved by integration with content identification systems such as EIDR and MovieLabs Media Manifest and Avails protocols. Netflix is actively involved in these initiatives.
  5. We are committed to building and maintaining scalable web-services for validating and perhaps even authoring IMF packages. We believe that this would be a significant step towards addressing the needs of the IMF community at large, and further helping drive IMF adoption in the industry.

The Future of Photon

Photon will evolve over time as we continue to build our IMF content ingestion workflow. As indicated in the very first article in this series “IMF: A Prescription for Versionitis” Netflix realizes that IMF will provide a scalable solution to some of the most common challenges in the Digital Supply Chain ecosystem. However, some of the aspects that bring in those efficiencies such as a model for interactive content, integration with content identification systems, scalable web services for IMF validation, etc. are under development. Good authoring tools will drive adoption and we believe they are critical for the success of IMF. By participating in various standardization activities around IMF we have the opportunity to constantly review possible areas of future development that would not only enhance the usability of Photon but also aid in IMF adoption through easy-to-use open source tools.

Conclusions

IMF is an evolving standard - while it addresses many problems in the Digital Supply Chain ecosystem, challenges abound and there is opportunity for further work. The success of IMF will depend upon participation by content partners, fulfillment partners as well as content retailers. At this time, Netflix is 100% committed to the success of IMF.


Product Integration Testing at the Speed of Netflix

$
0
0

The Netflix member experience is delivered using a micro-service architecture and is personalized to each of our 80+ million members.  These services are owned by multiple teams, each having their own lifecycle of build and release. This means it is imperative to have a vigilant and knowledgeable Integration Test team that ensures end-to-end quality standards are maintained even as microservices are deployed every day in a decentralized fashion.

As the Product Engineering Integration Test team, our charter is to not impact velocity of innovation while still being the gatekeepers of quality and ensuring developers get feedback quickly. Every development team is responsible for the quality of their team’s deliverables. Our goal is to work seamlessly across various engineering groups with a focus on end-to-end functionality and coordination between teams. We are a lean team with a handful of integration test engineers in an organization of 200+ engineers.


Innovating at a blistering pace while ensuring quality is maintained continues to create interesting challenges for our team. In this post, we are going to look at three such challenges -


  1. Testing and monitoring for High Impact Titles (HIT’s)
  2. A/B testing
  3. Global launch

Testing and monitoring High Impact Titles

There are a lot of High Impact Titles (HIT’s) - like Orange is the New Black - that regularly launch on Netflix. HIT’s come in all forms and sizes. Some are serialized, some are standalone, some are just for kids, some launch with all episodes of a season at once and some launch with a few episodes every week. Several of these titles are launched with complicated A/B tests, where each test cell has a different member experience.


These titles have high visibility for our members and hence need to be tested extensively. Testing starts several weeks before launch and ramps up till launch day. After launch we monitor these titles on different device platforms across all countries.


Testing strategies differ by the phase they are in. There are different promotion strategies for different phases which makes testing/automating a complicated task. There are primarily two phases:


  1. Before title launch : Prior to launch we have to ensure that the title metadata is in place to allow a smooth operation on launch day. Since there are lot of teams involved in the launch of a HIT, we need to make sure that all backend systems are talking to each other and to the front end UI seamlessly. The title is promoted via Spotlight (this is the large billboard-like display at the top of the Netflix homepage), teasers and trailers. However, since there is personalization at every level at Netflix, we need to create complex test cases to verify that the right kind of titles are promoted to the right member profiles. Since the system is in flux, it makes automation difficult. So most testing in this phase is manual.


  1. After a title is launched : Our work does not end on launch day. We have to continuously monitor the launched titles to make sure that the member experience is not compromised in any way. The title becomes part of the larger Netflix catalog and this creates a challenge in itself. We now need to write tests that check if the title continues to find its audience organically and if data integrity for that title is maintained (for instance, some checks verify if episode summaries are unchanged since launch, another check verifies if search results continue to return a title for the right search strings). But with 600 hours of Netflix original programming coming online this year alone, in addition to licensed content, we cannot rely on manual testing here. Also, once the title is launched, there are generic assumptions we can make about it, because data and promotional logic for that title will not change - e.g. number of episodes > 0 for TV shows, Title is searchable (for both movies and TV shows), etc. This enables us to use automation to continuously monitor them and check if features related to every title continue to work correctly.


HIT testing is challenging and date driven. But it is an exhilarating experience to be part of a title launch, making sure that all related features and backend logic are working correctly at launch time. Celebrity sightings and cool Netflix swag are also nice perks :)


A/B Testing

We A/B test a lot. At any given time, we have a variety of  A/B tests running, all with varying levels of complexity.


In the past, most of the validation behind A/B tests was a combination of automated and manual testing, where the automated tests were implemented for individual components (white box testing), while end-to-end testing (black box testing) was mostly conducted manually. As we started to experience a significant increase in the volume of A/B tests, it was not scalable to manually validate the tests end-to-end, and we started ramping up on automation.


One major challenge with adding end-to-end automation for our A/B tests was the sheer number of components to automate. Our approach was to treat test automation as a deliverable product and focus on delivering a minimum viable product (MVP) composed of reusable pieces. Our MVP requirement was to be able to assert a basic member experience by validating the data from the REST endpoints of the various microservices. This gave us a chance to iterate towards a solution instead of searching for the perfect one right from the start.  


Having a common library which would provide us with the capability to reuse and repurpose modules for every automated test was an essential starting point for us. For example, we had an A/B test which caused modifications to a member’s MyList - when automating this, we wrote a script to add/remove title(s) to/from a member’s MyList. These scripts were parameterized such that they could be reused for any future A/B test that dealt with MyList. This approach enabled us to automate our A/B tests faster since we had more reusable building blocks. We also obtained efficiency by reusing as much existing automation as possible. For example,  instead of writing our own UI automation, we were able to utilize the Netflix Test Studio to trigger test scenarios that required UI actions across various devices.


When choosing a language/platform to implement our automation in, our focus was on providing quick feedback to the product teams. For that we needed really fast test suite execution, on the order of seconds. We also wanted to make our tests as easy to implement and deploy as possible. With these two requirements in mind, we discounted our first choice -  Java. Our tests would have been dependent on the use of several interdependent jar files, and we would have had to account for the overhead of dependency management, versioning, and be susceptible to changes in different versions of the jars. This would significantly increase the test runtimes.


We decided to implement our automation by accessing microservices through their REST endpoints, so that we could bypass the use of jars, and avoid writing any business logic. In order to ensure the simplicity of implementation and deployment of our automation, we decided to use a combination of parameterized shell and python scripts that could be executed from a command line. There would be a single shell script to control test case execution, which would call other shell/python scripts that would function as reusable utilities.


This approach yielded several benefits:


  1. We were able to obtain test runtimes (including setup and teardown) within a range of 4 - 90 seconds, with a median runtime of 40 seconds. Using java-based automation, we estimate our median runtimes to have taken between 5 and 6 minutes.
  2. Continuous Integration was simplified - All we needed was a Jenkins Job which would download the code from our repo, execute the necessary scripts, and log the results. Jenkins’ built-in console log parsing was also sufficient enough to provide test pass/fail statistics.
  3. It is easy to get started - In order for another engineer to run our test suite, the only thing needed is access to our git repo and a terminal.

Global Launch

One of our largest projects in 2015 was to make sure we had sufficient integration testing in place to ensure Netflix’s simultaneous launch in 130 countries would go smoothly. This meant that, at a minimum, we needed our smoke test suite to be automated for every country and language combination. This effectively added another feature dimension to our automation product.


Our tests were sufficiently fast, so  we initially decided that all we needed was to run our test code in a loop for each country/locale combination. The result was that tests which completed in about 15 seconds would now take a little over an hour to complete. We had to find a better approach to this problem. In addition to this, each test log was now about 250 times larger, making it more onerous to investigate failures. In order to address this, we did two things:


  1. We utilized the Jenkins Matrix plugin to parallelize our tests so that tests for each country would run in parallel. We also had to customize our Jenkins slaves to use multiple executors so that other jobs wouldn’t queue up in the event our tests ran into any race conditions or infinite loops. This was feasible for us because our automation only had the overhead of running shell scripts, and not having to preload binaries.


  1. We didn’t want to refactor every test written up to this point, and we didn’t want every test to run against every single country/locale combination. As a result, we decided to use an opt-in model, where we could continue writing automated tests the way we had been writing them for a while, and to make a test global-ready, an additional wrapper would be added to the test. This wrapper would take in the test case id, and country/locale combination as parameters and then execute the test case with those parameters, as shown below:


Today, we have automation running globally that covers all high priority integration test cases including monitoring for HITs in all regions where that title is available.

Future Challenges

The pace of innovation doesn’t slow down at Netflix, it only accelerates. Consequently, our automation product continues to evolve. Some of the projects in our roadmap are:


  1. Workflow-based tests: This would include representing a test case as a workflow, or a series of steps to mimic the flow of data through the Netflix services pipeline. The reason for doing this is to reduce the overhead in investigating test failures, by easily identifying the step where the failure occurred.


  1. Alert integration: Several alerting systems are in place across Netflix. When certain alerts are triggered, it may not be relevant to execute certain test suites. This is because the tests would be dependent on services which may not be functioning at 100%, and would possibly fail - giving us results that would not be actionable for us. We need to build a system that can listen to these alerts and then determine what tests need to be run.


  1. Chaos Integration: Our tests currently assume the Netflix ecosystem is functioning at 100%, however, this may not always be the case. The reliability engineering team constantly runs chaos exercises to test the overall integrity of the system. Presently, the results of test automation in a degraded environment show upwards of a 90% failure rate. We need to enhance our test automation to provide relevant results when executed in a degraded environment.


In future blog posts, we will delve deeper and talk about ongoing challenges and other initiatives. Our culture of Freedom and Responsibility plays a significant role in enabling us to adapt quickly to a rapidly evolving ecosystem. There is much more experimentation ahead, and new challenges to face. If new challenges excite you as much as they excite us, join us.

Global Languages Support at Netflix - Testing Search Queries

$
0
0

Globalization at Netflix

Having launched the Netflix service globally in January, we now support search in 190 countries.  We currently support 20 languages, and this will continue to grow over time.  Some of the most challenging language support was added while launching in Japan and Korea as well as in the Chinese and Arabic speaking countries.  We have been working on tuning the language specific search prior to each launch by creating and tuning the localized datasets of the documents and their corresponding queries.  While targeting a high recall for the launch of a new language, our ranking systems focus on increasing the precision by ranking the most relevant results high on the list.

In the pre-launch phase, we try to predict the types of failures the search system can have by creating a variety of test queries including exact matches, prefix matching, transliteration and misspelling.  We then decide whether our generic field Solr configuration will be able to handle these cases or a language specific analysis is required, or a customized component needs to be added.  For example, to handle the predicted transliterated name and title issues in Arabic, we added a new character mapping component on top of the traditional Arabic Solr analysis tools (like stemmer, normalization filter, etc), which increased the precision and recall for those specific cases.  For more details, see the attachment description document and the patch for the LUCENE-7321.

Search support for languages follows the localization efforts, meaning we don't support languages which are not on our localization path. These unsupported languages may still be searchable with untested quality.  After the launch of localized search in a specific country, we analyze many metrics related to recall (zero results queries), and precision (click through rates, etc), and make further improvements.  The test datasets are then used for regression control when the changes are introduced.  

We decided to open source the query testing framework we use for pre-launch and post launch regression analysis.  This blog introduces a simple use case and describes how to install and use the tool with Solr or Elasticsearch search engine.

Motivation

When retrieving search results, it is useful to know how the search system handles the language specific phenomena, like morphological variations, stopwords, etc.  Standard tools might work well within most general cases, like English language search, but not as well with other languages.  In order to measure the precision of the results, one could manually count the relevant results and then calculate the precision at result ‘k’.  Doing so on a larger scale is problematic as it requires some set-up and possible customized UI to enter the ground truth judgments data.  
Possibly an even harder challenge is to measure the recall.  One needs to know all relevant documents in the collection in order to measure the recall.  We developed an open source framework which attempts to make these challenges easier to tackle by allowing the testers to enter multiple valid queries per target document using Google spreadsheets.  This way, there is no need for a specialized UI, and the focus of testing could be spent on entering the documents and related queries in the spreadsheet format.  The dataset could be as small as a hundred documents, and a few hundred queries in order to collect the metrics which will help one tune the system for precision/recall.  It is worth mentioning that this library is not concerned with the ranking of the results, but rather an initial tuning of the results, typically, optimized for recall.  Other components are used to measure the relevancy of the ranking.

Description

Our query testing framework is a library which allows us to test a dataset of queries against a search engine. The focus is on the handling of tokens specific to different languages (word delimiters, special characters, morphemes, etc...). Different datasets are maintained in Google spreadsheets, which can be easily populated by the testers. This library then reads the datasets, runs the tests against the search engine and publishes the results.  Our dataset has grown to be around 10K documents, over 20K queries, over 20 languages and is continuously growing.
Although we have been using this on the short title fields, it is possible to use the framework against small-to-medium description fields as well.  Testing the complete large documents (e.g. 10K characters) will be problematic, but the test cases could be added for the snippets of the large documents.

Sample Application Test

Input Data

We will go over a use case which tunes a short autocomplete field.  Let’s create a small sample dataset to demonstrate the app.  Assuming the setup steps described in the Google Spreadsheet set-up are completed, you should have a spreadsheet like so after you copied it over from the sample spreadsheet (we use Swedish language for our small example):
id
title_en
title_localized
q_regular
q_regular
q_misspelled
1
Fuller House
Huset fullt – igen
Huset fullt
huset
2
Friends
Vänner
Vänne
Vanner
3
VANish
VANish
van

Input Data Column Descriptions

id - required field, can be any string, must be unique, there is a total of three titles in the above example.
title_en - required, English display name of the document.
title_localized - required, localized string of the document.
q_reqular - optional query field(s), at least one is necessary for the report to be meaningful.  ‘q_’ indicates that some queries will be entered in this column.  The query category follows the underscore, and it needs to match the list in the property:
search.query.testing.queryCategories=regular,misspelled
There are five queries in all.  We will be testing the localized title.  The english title will be used for debugging only.  Various query categories can be used to group the report data.

Search Engine Configuration

Please follow the set-up for Solr or set-up for Elasticsearchto run our first experiment.  In the set-up instructions there are four fields: id, query_testing_type (required for filtering during the test, so there is no results leaking from other types), and two title fields - title_en and title_sv.
The search will be done on title_sv.  The tokenization pipeline is
Index-time:
standard -> lowercase -> ngram
Search-time:
standard -> lowercase
That’s a typical autocomplete scenario.  The queries could be phrase queries with a slop, or dismax queries (phrase or non-phrase).  We use phrase queries for our testing with Elasticsearch or Phrase/EDismax queries with Solr in this example.  Essentially, the standard and lowercase are two basic items for many different scenarios (stripping the special characters and lowercasing), and the ngram produces the ngram tokens for the prefix match (suitable for an autocomplete cases).

Test 1: Baseline

You will need to make sure to complete the Google Spreadsheet set up, then build and run the tool against this data. This should produce the following summary report:
name
titles
queries
superset
Results
Failed
different
Results
Failed
no
Results
Failed
successQ
precision
recall
fmeasure
swedish-video-regular
3
4
0
0
0
4
100.00%
100.00%
100.00%
swedish-video-misspelled
1
1
0
0
1
0
0.00%
0.00%
0.00%

Summary Report Column Descriptions

supersetResultsFailed - this is a count of queries which have extra results, i.e. false positives (affecting the precision). Alternatively, these could be queries not assigned to the titles unintentionally, in which case adding these queries to the titles which missed them would fix these.
noResultsFailed - count of queries which didn’t contain the expected results (affecting the recall).
differentResultsFailed - queries with a combination of both - the missing documents, and the extra documents
successQ - queries matching the specification exactly
Precision - is calculated for all results, it is the number of relevant documents retrieved over the number of all retrieved results.
Recall - the number of relevant documents retrieved over the number of all relevant results.
Fmeasure - the harmonic mean of the precision and recall.
All measures are taken on the query level.  There is a total of three titles, and five queries.  Three queries are regular, and one query is in the misspelled query category.  The queries break down like so: one misspelled failed with noResultFailed, four have succeeded

Detail Results

The details report will show the specific details for the failed queries:
name
failure
query
expected
actual
comments
swedish-video-misspelled
noResultsFailed
Vanner
Vänner
NONE

Note that the detail report doesn’t display the results which were retrieved as expected, it only shows the difference of failed results.   In other words, if you don't see a title in the actual column for a particular query, it means the test has passed.

Test 2: Adding ASCII Folding

The case of the ASCII ‘a’ character being treated as a misspelling could be arguable, but does demonstrate the point.  Let’s say we decided to ‘fix’ this issue and apply the ASCII folding.  The only change was adding an ascii folding analyzer for the index time and search time (see the Test 2 for Solror Test 2 for Elasticsearch for the configuration changes).
If we run the tests again, we can see that the misspelled query was fixed at the expense of precision of the ‘regular’ query category:
name
titles
queries
superset
Results
Failed
different
Results
Failed
no
Results
Failed
successQ
precision
recall
fmeasure
swedish-video-regular
3
4
1
0
0
3
87.50%
100.00%
91.67%
swedish-video-misspelled
1
1
0
0
0
1
100.00%
100.00%
100.00%

The _diff tab shows the details of the changes.  The comments field is populated with the change status of each item.
name
titles
queries
superset
Results
Failed
different
Results
Failed
no
Results
Failed
successQ
precision
recall
fmeasure
swedish-video-regular
0
0
1
0
0
-1
-12.50%
0.00%
-8.33%
swedish-video-misspelled
0
0
0
0
-1
1
100.00%
100.00%
100.00%

The detail report shows the specific changes (one item was fixed, one failure is new):
name
failure
query
expected
actual
comments
swedish-video-misspelled
noResultsFailed
Vanner
Vänner
NONE
FIXED
swedish-video-regular
supersetResultsFailed
van
Vänner
NEW

At this point, one can decide that the new supersetResultsFailed is actually a legitimate result (Vänner) then go ahead and add query 'van' to that title in the input spreadsheet.

Summary

Tuning a search system by modifying the tokens extraction/normalization process could be tricky because it requires to balance the precision/recall goals. Testing with a single query at a time won't provide a complete picture of the potential side affects of the changes. We found that using the described approach gives us better results overall, as well as allows us to do regression testing when introducing the changes.  In addition to this, the collaborative way the Google spreadsheets allow the testers to enter the data, add the new cases, and comment on the issues, as well as a quick turn-around of running the complete suite of tests gives us the ability to run through the entire testing cycle faster.

Data Maintenance

The usage of the library is designed for experienced to advanced users of Solr/Elasticsearch.  DO NOT USE THIS ON PRODUCTION LIVE INSTANCES. The deletion of any data was removed from the library by design. When the dataset or configuration is updated (e.g. new tests are run), the search engine stale dataset removal is the developer responsibility.  However, users must bear in mind that if they run this library on a live prod node, while using the live prod doc ID’s, the test documents will override the existing document.  

Acknowledgments

I would like to acknowledge the following individuals for their help with the query testing project:
Lee Collins, Shawn Xu, Mio Ukigai, Nick Ryabov, Nalini Kartha, German Gil, John Midgley, Drew Koszewnik, Roelof van Zwol, Yves Raimond, Sudarshan Lamkhede, Parmeshwar Khurd, Katell Jentreau, Emily Berger, Richard Butler, Annikki Lanfranco, Bonnie Gylstorff, Tina Roenning, Amanda Louis, Moos Boulogne, Katrin Ashear, Patricia Lawler, Luiz de Lima, Rob Spieldenner, Dave Ray, Matt Bossenbroek, Gary Yeh, and Marlee Tart, Maha Abdullah, Waseem Daoud, Ally Fan, Lian Zhu, Ruoyin Cai, Grace Robinson, Hye Young Im, Madeleine Min, Mina Ihihi, Tim Brandall, Fergal Meade.

Reference

[1] - Precision and Recall https://en.wikipedia.org/wiki/Precision_and_recall
[2] - F-Measure https://en.wikipedia.org/wiki/Harmonic_mean
[3] - Solr Reference Guide https://cwiki.apache.org/confluence/display/solr/Apache+Solr+Reference+Guide
[4] - Elasticsearch Reference Guide https://www.elastic.co/guide/en/elasticsearch/reference/2.3/index.html

Source


Artifacts

Query testing framework binaries are published to Maven Central.  For gradle dependency:
compile 'com.netflix.search:q:1.0.2'
Viewing all 303 articles
Browse latest View live